Pinecone has grabbed the #1 spot across nearly every year-end list because it’s the only purpose-built vector database that can easily scale to meet production computing and latency requirements.
To harness the full power of Pinecone in a production environment, though, developers need to do more than simply use Pinecone – they need to use us in a computationally efficient way.
Unique to Pinecone
Use the gRPC Client
When working with Pinecone in high-throughput environments, you should use the gRPC client, available through the Python SDK. Through multiplexing, gRPC is able to handle large amounts of requests in parallel without slowing down the rest of the system (HoL blocking), unlike REST. Moreover, you can pass various retry strategies to the gRPC client, including exponential backoffs (more on retries later).
# pip3 install "pinecone-client[grpc]"

import pinecone

# Initialize Pinecone w/our credentials (available at app.pinecone.io)
pinecone.init(api_key='<your key>', environment='<your env>')

index = pinecone.GRPCIndex('name-of-your-index')
Jumpstart your app with the Reference Architecture
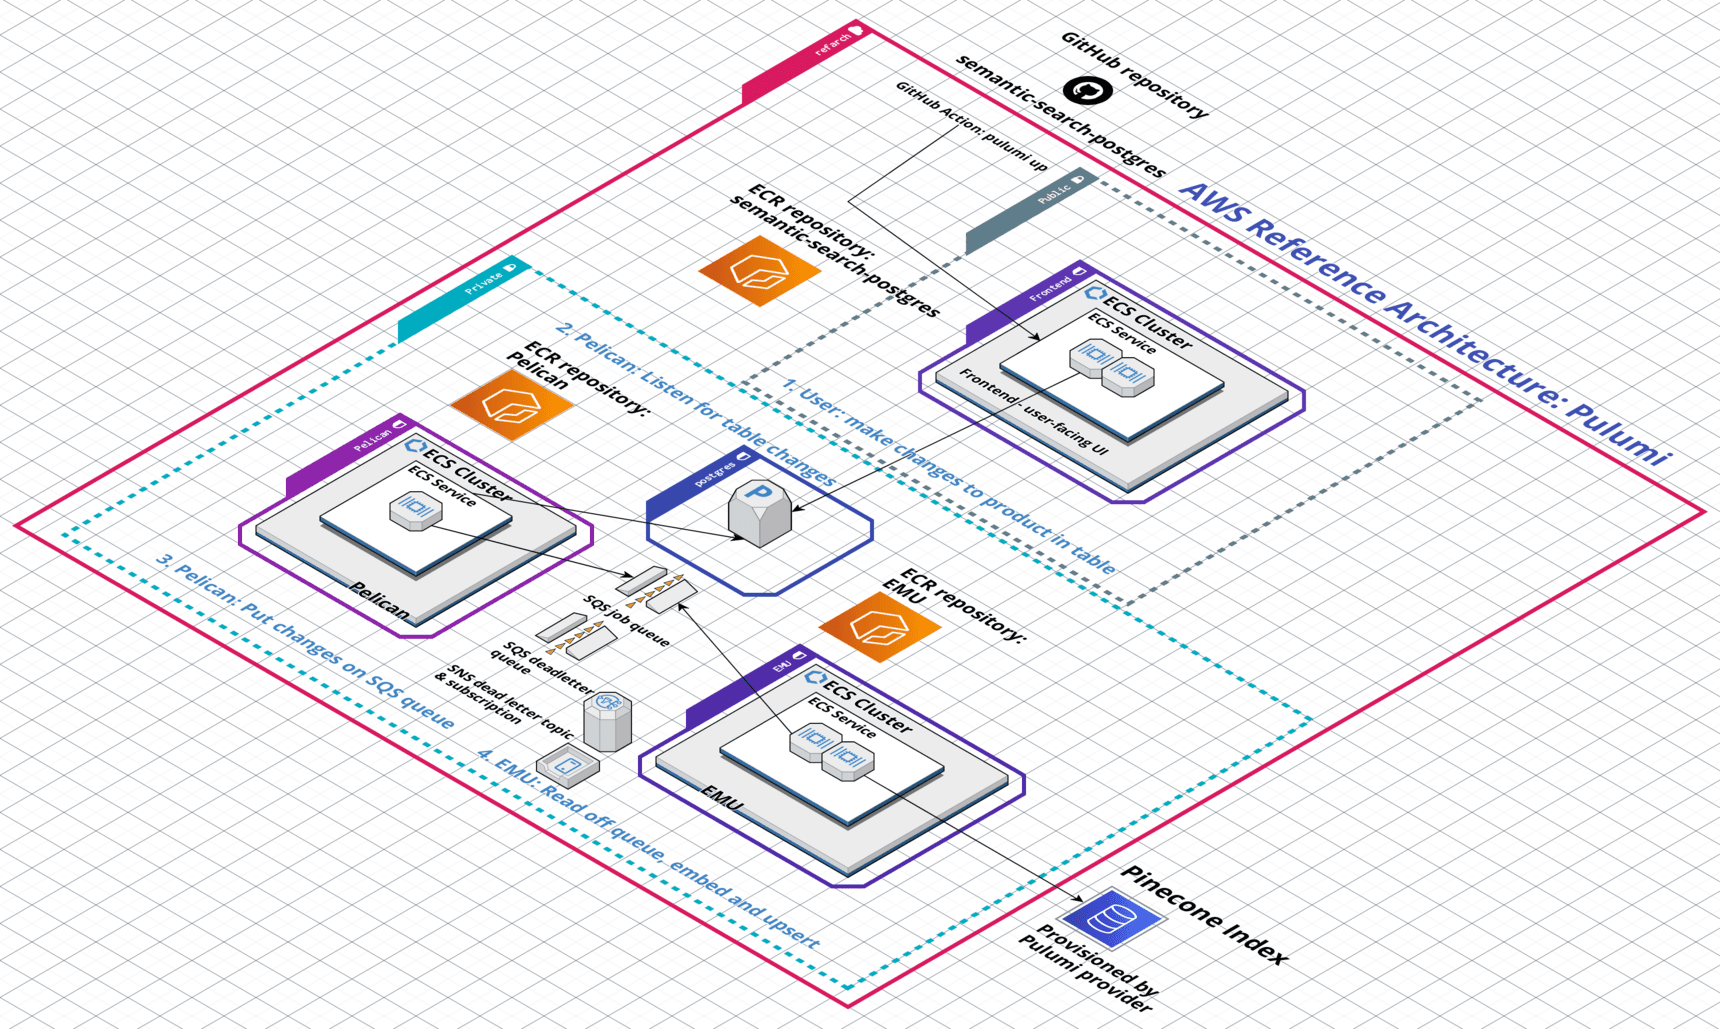
We recently published a “reference architecture,” i.e. an IaC blueprint that spins up all the infrastructure needed to launch a production service in a distributed environment. The Architecture is composed of microservices that are purpose-built to run in parallel in high-throughput, production environments. Check it out and tell us what you think!
Scale your infrastructure
Pinecone users can scale their indexes vertically or horizontally. Vertical scaling (or scaling “up”) gives you more compute resources, while horizontal scaling (or scaling “out”) gives you more machines over which you can distribute load.
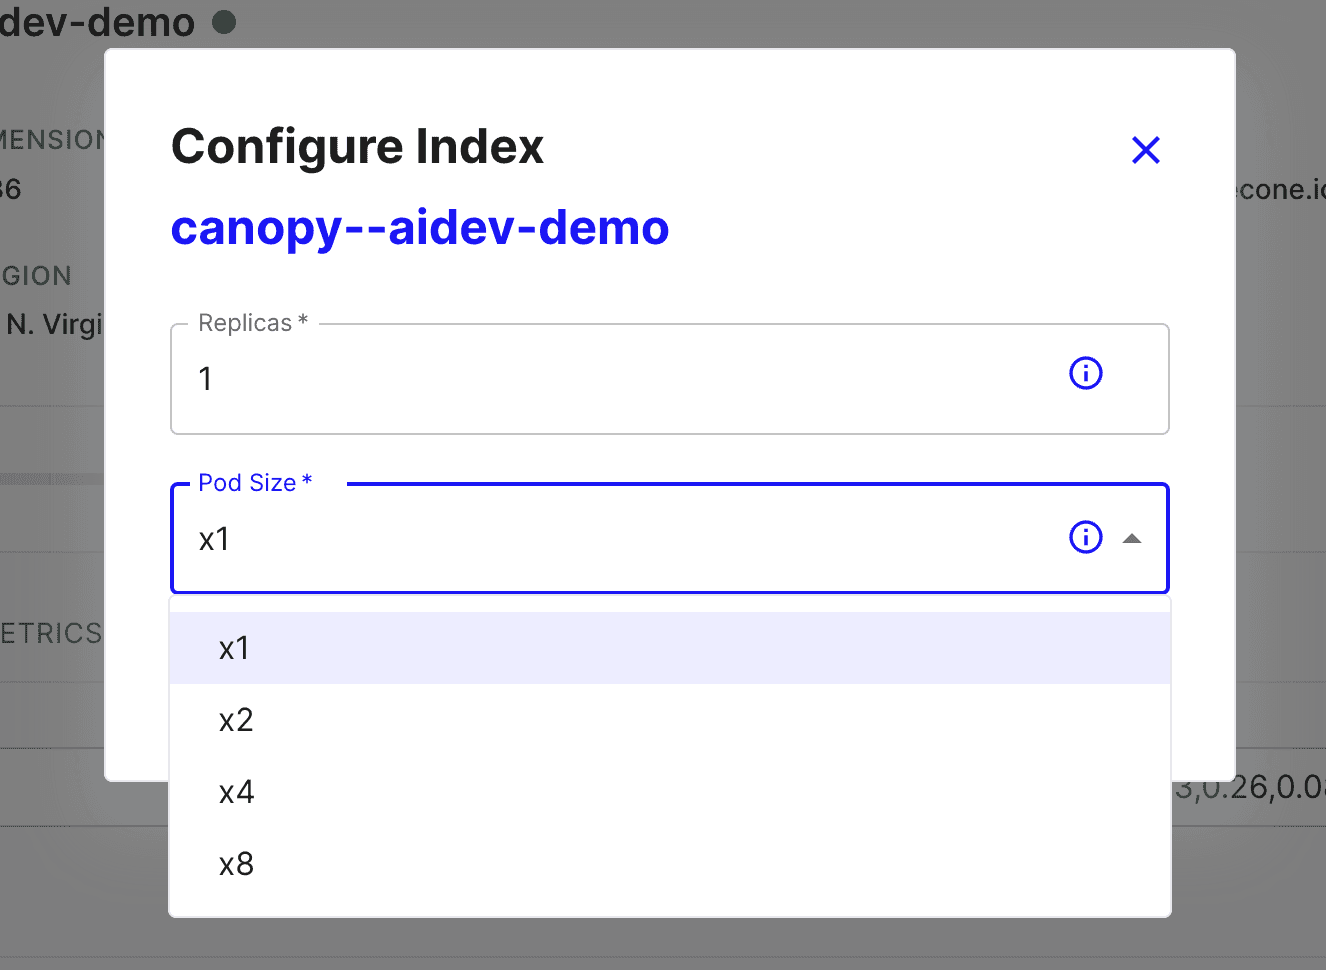
You can scale your indexes via the Pinecone dashboard (shown above) or programmatically through our SDKs.
In general, if you need more power, you scale vertically by increasing your pod size; if you need higher availability to serve concurrent requests, you scale horizontally by increasing the number of replicas.
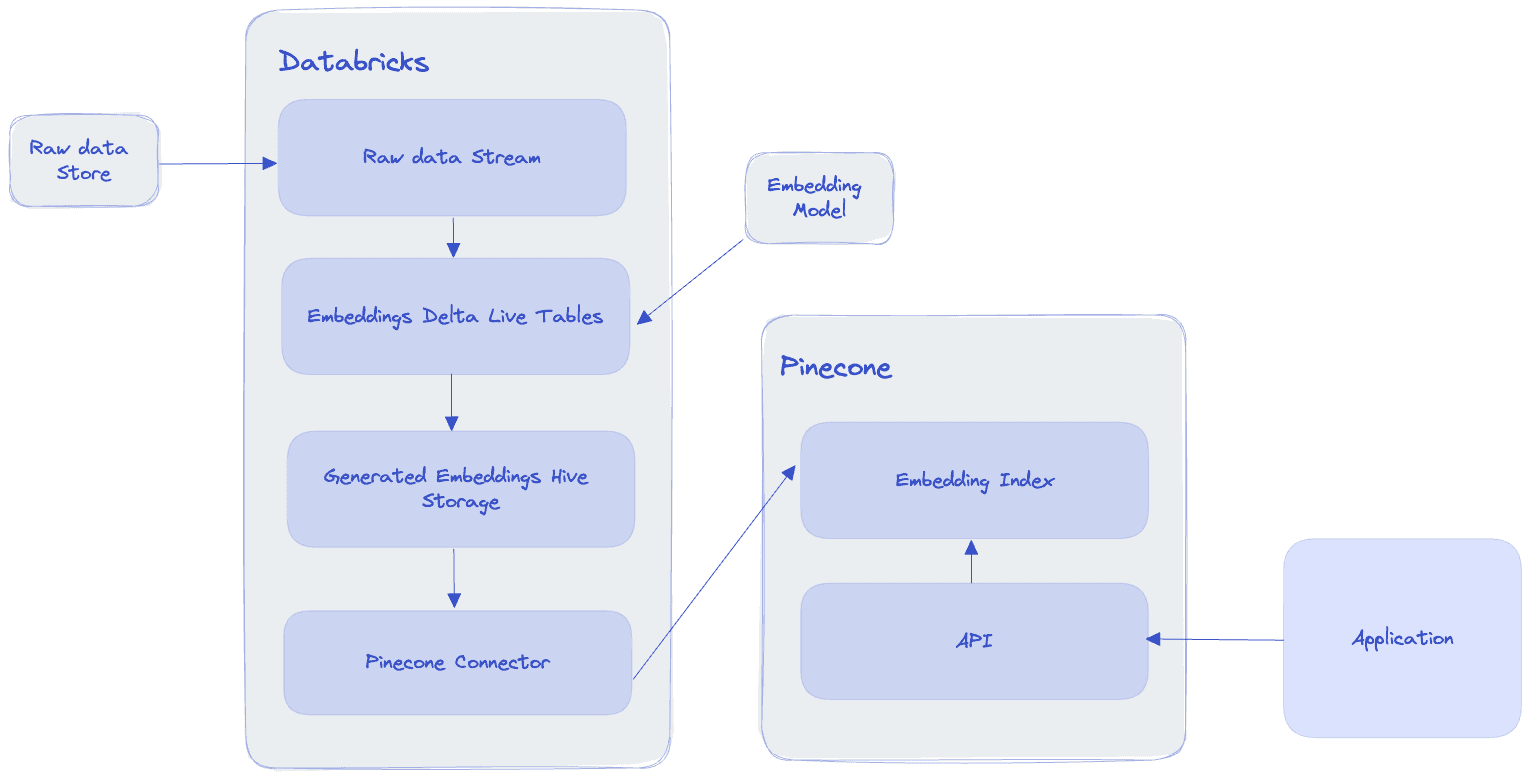
Try our Databricks integration
Pinecone has multiple integrations and connectors users can access. Of particular use for high throughput applications is the Databricks integration. Since Databricks is built on top of Spark, a big-data processing and analytics platform, it’s an ideal environment in which to build large-scale applications.
Concurrency and Parallelism
Key to writing code that performs well at scale is implementing concurrency and/or parallelism. Running code concurrently or in parallel allows your application to process requests from many clients and/or perform computationally heavy operations quickly.
Concurrency is when your code is executed nearly simultaneously, while parallelism is when your code is executed simultaneously (while distributed computing is when your code is executed simultaneously across multiple computers). One of the most popular ways to achieve concurrency is through multithreading; one of the most popular ways to achieve parallelism is through multiprocessing.
Multithreading
A thread is a lightweight unit of execution that shares the same memory space as other threads in a process. Each CPU core on a machine (computer) can hold up to two threads.
Multithreading is when your program spins up many of these threads to execute a script. This can speed up I/O-bound programs (programs that deal with Inputs and Outputs), such as reading and writing files to a database.
An interesting note about multithreading (in Python) is that the Python interpreter can only ever run on a single thread. This constraint is enforced through something called the Global Interpreter Lock, or the GIL. In a multithreaded program, what’s actually happening is that the Python interpreter is efficiently hopping from one thread to the next during downtime (e.g. when you script is waiting for an API response).
Despite its single-threaded nature, multithreading does have a significant impact on the speed of your program’s execution and is worth implementing in I/O-bound workloads.
A nice multithreading utility to use is Python’s ThreadPoolExecutor. Use it as a context generator with futures:
from concurrent.futures import ThreadPoolExecutor

def some_io_bound_program():
    # Read or write docs
    # Hit an API endpoint
    # etc.

def execute_some_code_concurrently(threads):
    with ThreadPoolExecutor(max_workers=threads) as executor:
        future = executor.submit(some_io_bound_program())
        print(future.result)
Multiprocessing
Multiprocessing is when a program relies on multiple CPU cores (within the same machine) to execute a program. When multiple CPUs are running, a program can be executed in parallel, with each CPU core executing a self-contained instance of the program (i.e. with its own GIL).
The actual code to execute a multiprocessed program is the same as the code used to execute the multithreaded program above, except that you use Python’s ProcessPoolExecutor.
Multiprocessing is great for CPU-bound programs that execute computationally heavy code consistently throughout their runtime, such as video processing.
Note that since CPU-bound scripts need the computer’s power consistently throughout their execution, spinning up multiple threads (which, as mentioned above, can really only be used one at a time by the Python interpreter) can actually slow down your program.
TLDR: Use multithreading with I/O-bound scripts, use multiprocessing with CPU-bound scripts.
Batching
When you have to process large amounts of data (e.g. >10M vectors), you want to use batch processing.
Batch processing is the concept of sending data somewhere (e.g. an API endpoint, a database, etc.) in groups (“batches”), rather than as individual data points. Batching significantly reduces the time it takes to process data.
When implementing batching, you’ll want to do the following to keep things clean and concise:
- Keep track of how many items you’ve batched out of your total items
- Keep track of each batch’s size
- (Pinecone caps payload sizes at 2MB. Since each vector can store up to 40KB of metadata, you’ll want to ensure that any batches of objects (vector+metadata) you’re upserting do not exceed 2MB.)
- Handle failures gracefully
- Write logs to confirm everything is working as expected
Here’s a simple template that does all of the above:
from typing import List
import logging
import requests
from tenacity import retry, stop_after_attempt, wait_fixed

logging.basicConfig(level=logging.INFO)

# Dummy API endpoint
API_ENDPOINT = "https://example.com/api/send"

# List of 10 items to send
items = ["item1", "item2", "item3", "item4", "item5", "item6", "item7", "item8", "item9", "item10"]

def estimate_batch_size(batch: List[str]) -> int:
    """
    Estimate the size of the batch in bytes.
    """
    return sum(len(item.encode('utf-8')) for item in batch)


@retry(stop=stop_after_attempt(3), wait=wait_fixed(1))
def send_data(batch: List[str]) -> str:
    """
    :param batch: Batch of data to send to an API endpoint.
    :return: API endpoint response.
    """
    response = requests.post(API_ENDPOINT, json=batch)
    response.raise_for_status()  # Will trigger retry on failure
    return response.json()


# Make our batch size 2
batch_size = 2
total_items = len(items)

# Divide up the `items` list into batches of 2
batches = [items[i:i + batch_size] for i in range(0, total_items, batch_size)]

# Iterate through batches and send to endpoint
for i, batch in enumerate(batches):
    try:
        batch_size_bytes = estimate_batch_size(batch)
        if batch_size_bytes > 2 * 1024 * 1024:  # 2MB in bytes
            logging.info(f"Skipping batch {i+1}: size exceeds 2MB")
            continue

        print(f"Sending batch {i+1}/{len(batches)}: {batch}")

        # Send data
        result = send_data(batch)

        logging.info(f"Batch {i+1} sent successfully. Result: {result}")

    except Exception as e:
        logging.info(f"Failed to send batch {i+1}. Error: {e}")

    finally:
        items_left = total_items - (i+1) * batch_size
        logging.info(f"Items batched so far: {(i+1) * batch_size}, Items left: {max(items_left, 0)}")

logging.info("Batch processing complete.")
Handling failures
Failures happen. Batch processing can make capturing those failures difficult. A popular way to handle failures (or exceptions) during batch processing is to incorporate retries (you can also implement a ‘dead letter queue’, but we won’t go into that here).
In the code block above, you’ll notice a decorator object called @retry. This is a retry mechanism from tenacity that retries that script up to 3 times, waiting 1 second in between tries. After 3 tries, it will give up and fail.
While waiting n-seconds between tries and giving up after x tries is a fine strategy, we can do better.
(These canonical posts on retries are great to gain a deeper understanding.)
Exponential backoffs
Incorporating what’s called an “exponential backoff” into your retries is a good alternative.
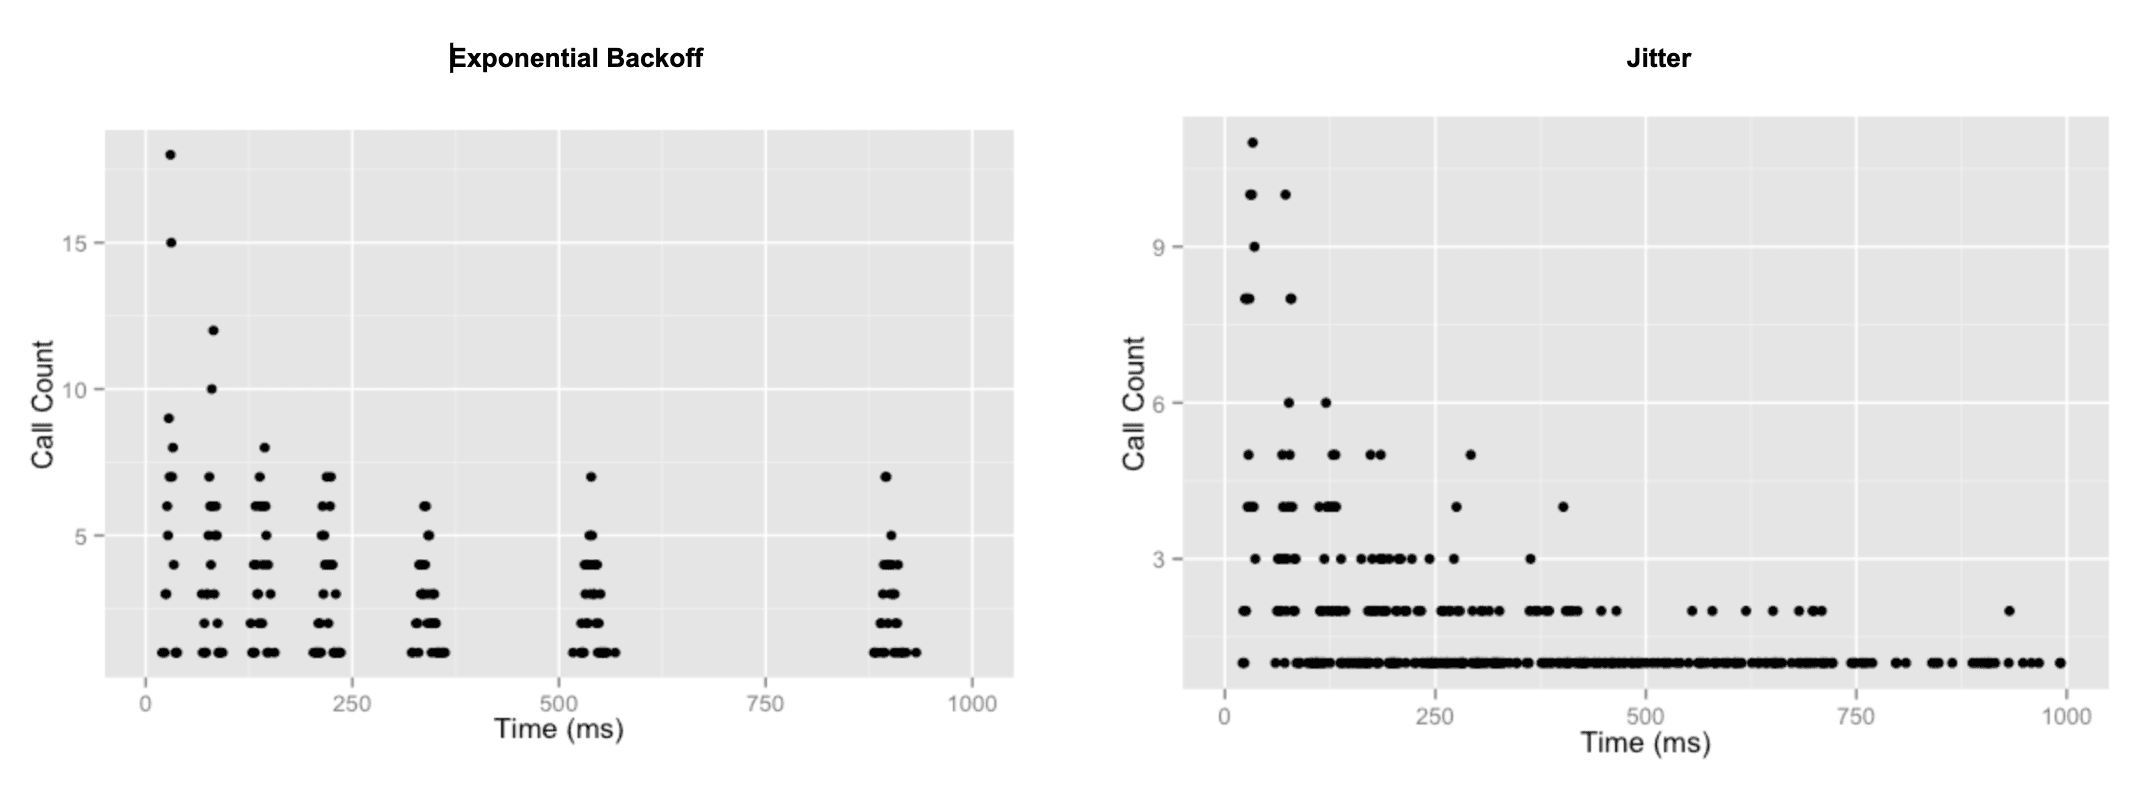
When a retry contains an exponential backoff, it simply means that your script will exponentially increase the amount of time it waits between trying some action again (usually until it hits some max number of retries).
With tenacity, you can implement exponential backoffs easily.
Jitter
Incorporating ‘jitter’ into your retry strategy is an even better alternative. Adding jitter to a retry is simply adding randomness. It sounds counterintuitive at first, but the addition of randomness actually stabilizes the distribution of your retries.
While exponential backoffs (exponentially) increase the amount of time between each retry, the retries still occur in spikes. When we add jitter to those retries, over time the randomness actually approximates a uniform distribution.
Tenacity’s retry library is great for this, too.
Logging
Last but not least, writing logs to a centralized location for downstream analysis and storage is key to working with large-scale data in production.
Log-writing strategies could be a blog post in and of itself, but for now we’ll look at 3 common places into which developers write logs: local files, databases, and/or full-service logging platforms.
Note: if your logs are running in a distributed environment, ensure your solution can handle simultaneous write requests, e.g. by using of QueueHandlers or SocketHandlers.
Files
Making use of Python’s logging facility is the lowest hanging fruit available to most developers. With logging, you declare a logging level (usually INFO, WARN, or ERROR), instantiate a logging object, and then you’re off to the races. You can log messages of differing severity to unique locations using Handlers.
We recommend using the __name__ dunder method to implement module-level logging. This way you automagically have a unique logging object per module.
import logging

logger = logging.getLogger(__name__)  # Module level logging

# Configure where you want your logs to go
# Here it is a file called "example.log"
# Only messages of severity DEBUG will write to this file
logging.basicConfig(filename='example.log', encoding='utf-8', level=logging.DEBUG)


def some_code():
    """
    Dummy function to illustrate logging.
    """
    some_var = 'hello'
    another_var = 'goodbye'
    concatted_vars = some_var + another_var
    logger.DEBUG(f'Final concatenated string = {concatted_vars}\n')  # This will write to example.log
    return concatted_vars
Databases
Moving up the hierarchy of logging best practices, we arrive at writing logs to a centralized database. The key here is that instead of writing logs to a local file, we write logs to a resilient storage layer that is accessible to everyone (with permissions).
Storing logs in a centralized database can be as simple as writing local log files to the database, or as complicated as streaming log lines into the database. Whichever route you take, ensure you include enough information in your logs to understand the user journey when analyzing them downstream (i.e. don’t forget timestamps!).
Optimized platforms
For a full-fledged log storage and analysis one-stop-shop, we like Grafana. Full-service platforms like Grafana, New Relic, Dynatrace, etc. usually have third-party integrations that make using them relatively easy.
In addition to aggregating your logs in a central location, what’s nice about services like Grafana and others is that engineers can analyze their logs in situ via graphs, metrics, etc.
Conclusion
In conclusion, when writing code for high throughput, production environments, you’ll want to:
- Use native Pinecone constructs to speed up your code execution
- Implement multithreading or multiprocessing
- Batch process your data
- Write and analyze awesome logs
By working these strategies into your code practice, you’ll see significant latency decreases and be a happier coder.

Share your Pinecone journey with us at community.pinecone.io.
Was this article helpful?