RAG Evaluation: Don’t let customers tell you first
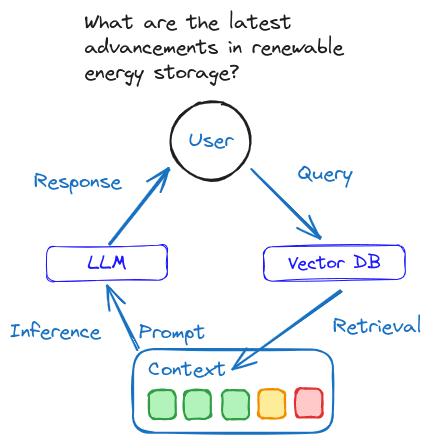
Retrieval augmented generation (RAG) is an architecture that provides the most relevant and contextually important proprietary, private, or dynamic data to your Generative AI application's large language model (LLM) when performing tasks to enhance its accuracy and performance.
Your application presents the prompt, which includes your end user’s query and the retrieved context, to your LLM at inference time:
RAG evaluation measures your pipeline’s performance
To evaluate the performance of Retrieval-Augmented Generation systems, we must understand how well the retrieval component selects and ranks relevant documents or data.
RAG evaluation quantifies the accuracy of your retrieval phrase by calculating metrics on the top results your system returns, enabling you to programmatically monitor your pipeline’s precision, recall ability, and faithfulness to facts.
First, we’ll examine some of the most commonly used metrics and how they are derived. Then, we’ll survey frameworks and tooling that employ these metrics to quantify the performance of your RAG deployment.
Finally, we’ll help you choose the best framework and tooling for your use case to ensure your RAG deployments consistently achieve your performance goals.
Note: this chapter focuses on RAG pipelines. For an in-depth treatment of Information Retrieval metrics applied broadly, see Evaluating Measures in Information Retrieval.
For an analysis using these metrics to measure the performance of Pinecone Assistant, see Benchmarking AI Assistants.
Understanding binary relevance metrics
While different frameworks combine metrics and sometimes create custom metrics, grounding in common information retrieval formulas will help you evaluate which frameworks best suit your use cases. The following is not an exhaustive list of available metrics but a good starting point.
The retrieval metrics we’re examining first fit under the binary relevance umbrella, where a result is either relevant or irrelevant. There are two categories of metrics that observe binary relevance: Order-unaware and Order-aware.
Order-unaware metrics examine if results are relevant and correct, regardless of which order they’re in. In contrast, order-aware metrics penalize systems that return less relevant results in the top positions.
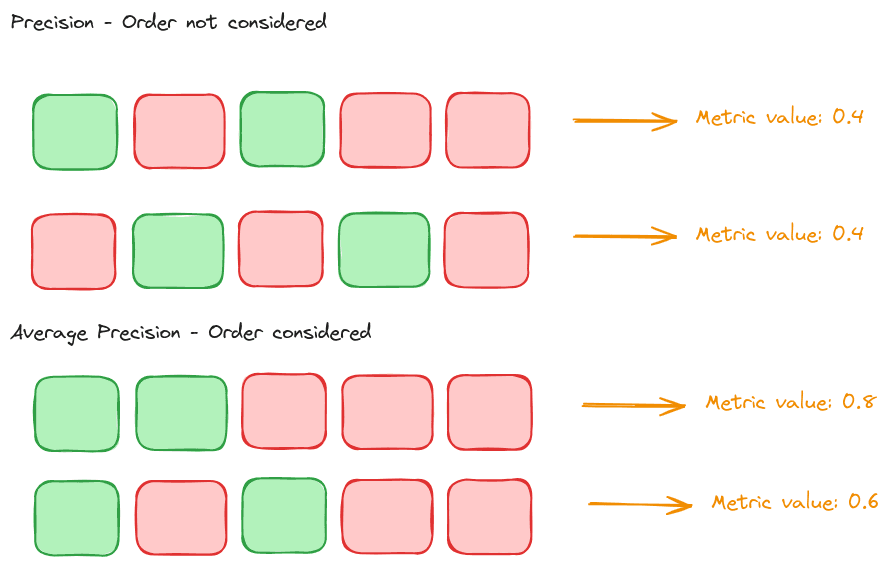
For example, Precision and Average Precision are two information retrieval metrics. Precision does not care about the result order, so it’s called order-unaware. Conversely, Average Precision does consider the relative position of results.
In the following example, a higher metric value is better:
Order-unaware metrics
Precision@k
Precision@k examines how many items in the result set are relevant, where K is the number of results considered.
Precision@k is ideal for scenarios where the accuracy of each result is more important than finding every possible relevant result. It is beneficial when user time is limited, reviewing irrelevant results is expensive, you prefer the quality of results over quantity, or initial impressions matter.
For metrics such as Precision, which can be stated as precision@k, k operates like a sliding window, allowing us to consider the metric's value at a given position.
In the following examples, we speak of precision at k of 1, k of 2, or precision at k=3, for instance:
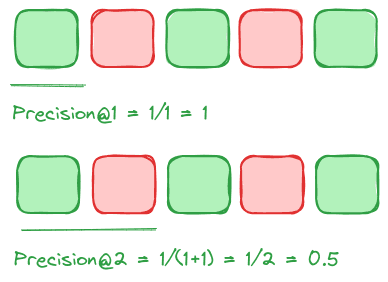
A key limitation of Precision@k is that it does not consider the relative position of results. Thus, it would equally score two retrieval sets with three relevant results, even if the second set had all three relevant results at the end.
Recall@k
Recall@k determines how many relevant results your retrieval step returns from all existing relevant results for the query, where K is the number of results considered.
Therefore, if we assume a k of 1, we’re really only looking at 1 of the 3 total relevant results for the query. This is why recall@k=1 is only 0.33 for the following example:
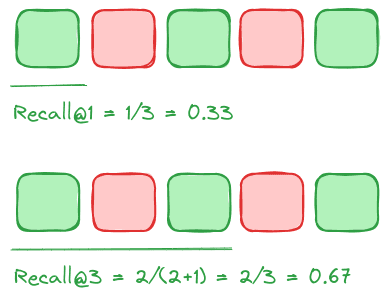
If we consider the first 3 items instead, the recall@k score is improved because the sliding window of results we’re observing now contains more of the total relevant results in the set.
Recall is ideal for scenarios where capturing all relevant items in the result set is essential, even if this means including some irrelevant ones. It is helpful when the cost of missing a relevant document is high, or the user is willing to review more results.
F1@k
How can we accurately score retrieval when concerned with precision and recall?
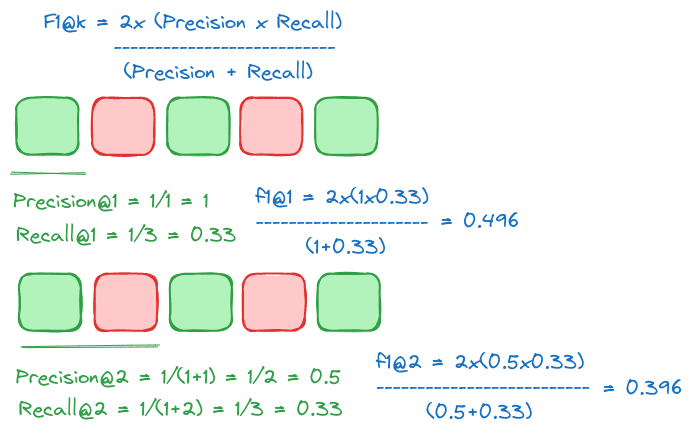
The F1 score combines precision and recall into a single metric. It is beneficial in scenarios where you must balance retrieving all relevant items (recall) and ensuring they are applicable (precision).
This metric is helpful in situations where missing relevant documents or retrieving too many irrelevant items is costly. It is used by some of the frameworks and monitoring tools we discuss later on as a metric of overall retrieval performance.
Order-Aware Metrics
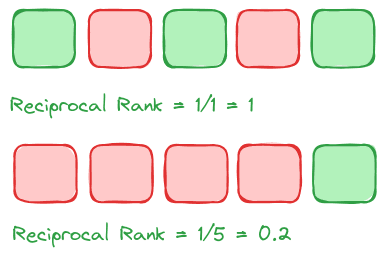
Mean Reciprocal Rank (MRR)
Mean Reciprocal Rank (MRR) is a metric well-suited for evaluating systems where the relevance of the top-ranked result is more important than the relevance of subsequent results. MRR tells us the average position of the first relevant item across result sets, hence the “mean.”
MRR ranges from 0 to 1, where a higher value indicates better performance and an MRR of 1 means the first result is always the correct answer for all queries.
MRR excels when the user receives one correct answer in fast-paced decision-making environments or when your goal is to bring as many relevant items as close to the top of the results set as possible.
In the first example, our MRR is 1 because the first relevant result is at position 1, whereas the MRR of the second example is 0.2. After all, the only appropriate result is at the end of the set.
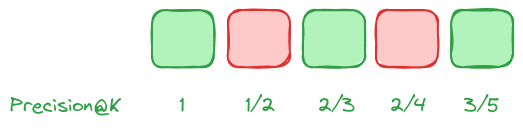
Average Precision (AP)
Average Precision assesses the quality of results in a ranking system where order is important. It is especially significant when you expect multiple relevant results across a list. Unlike MRR, which focuses on the position of the first relevant item, Average Precision considers all relevant results.
Therefore, Average Precision provides a robust measure of retrieval effectiveness across the entire result set, not just at the top.
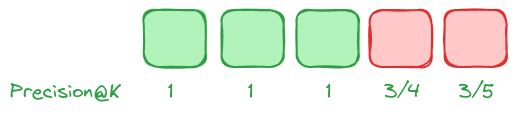
In this example, we use Precision@K values for each result to calculate the Average Precision:
We can see that when relevant results are placed higher in the results set, the Average Precision metric improves:
Understanding graded relevance metrics
The metrics we reviewed above deal with binary relevance: a result is either relevant or irrelevant, green or red, or yes or no.
What if we need to model shades of relevance, where one result might be extremely relevant while another is significantly less relevant but not totally irrelevant?
A given result could be assigned a relevance value ranging from 0 to 5, for example:

Graded relevance metrics address this spectrum.
Discounted Cumulative Gain and its counterpart, Normalized Discounted Cumulative Gain, are graded relevance metrics.
Discounted Cumulative Gain (DCG@k)
DCG is an order-aware metric that measures an item’s usefulness based on its rank in the result set. It incorporates a logarithmic penalty to diminish the value of items lower in the order. This penalty adjusts the relevance of each result, reflecting the intuition that top results are most valuable.
Here’s what that growing penalty looks like across our hypothetical set of five results:
| i | Logarithmic Penalty calculation | Penalty |
|---|---|---|
| 1 | log2(1+1) = log2(2) | 1 |
| 2 | log2(2+1) = log2(3) | 1.584 |
| 3 | log2(3+1) = log2(4) | 2 |
| 4 | log2(4+1) = log2(5) | 2.321 |
| 5 | log2(5+1) = log2(6) | 2.584 |
The further a relevant result is from the top of the set, the higher the penalty applied.
Discounted Cumulative Gain is useful, but a key limitation is that it does not account for the varying lengths of result sets and naturally favors longer sets. Therefore, it is difficult to fairly compare the DCG scores of two result sets of different lengths.
We can see this effect at work when considering two result sets of varying length, the first with relatively high relevance scores and the second with more items total but not higher relevance scores:
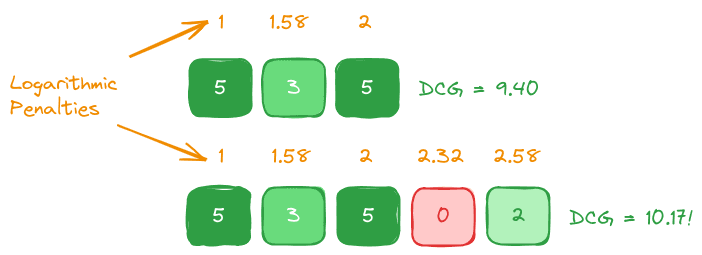
We can calculate the Discounted Cumulative Gain for the top row of 3 results like so:
Which gives us a DCG metric of 9.40.
Conversely, calculating the DCG for the second row of 5 results which is not generally of higher quality overall:
Which gives us 10.17!
This means that, even though the second longer result set was not significantly more relevant overall, it receives a higher DCG value due to having more items.
The Normalized Discounted Cumulative Gain (NDCG@k) metric addresses this limitation by applying normalization.
Normalized Discounted Cumulative Gain (DCG@k)
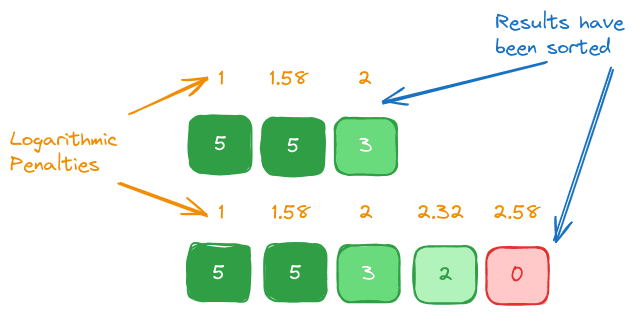
To compare DCG scores across queries fairly, we normalize them using the ideal DCG (IDCG) which assumes a perfect sort order by relevance:
NDCG, the ratio of DCG to IDCG, allows us to evaluate the ranking of relevant items near the top for sets of various lengths. NDCG thus provides a normalized score, making it possible to compare the performance of queries that return result sets of varying lengths.
To see how this plays out, we’ll calculate the Ideal DCG (IDCG) for our sorted result set above:
| Position | Relevance | log2 (i + 1) | Rel i / log2 (i + 1) | IDCG@k |
|---|---|---|---|---|
| 1 | 5 | log2(2) = 1 | 5/1 = 5 | 5 |
| 2 | 5 | log2(3) = 1.585 | 5/1.585 = 3.154 | 5 + 3.154 = 8.154 |
| 3 | 3 | log2(4) = 2 | 3/2 = 1.5 | 5 + 3.154 + 1.5 = 9.654 |
| 4 | 2 | log2(5) = 2.322 | 2/ 2.3219 = 0.861 | 5 + 3.154 + 1.5 + 0.861 = 10.515 |
| 5 | 0 | log2(6) = 2.585 | 0/2.5849 = 0 | 5 + 3.154 + 1.5 + 0.8516 + 0 = 10.515 |
In other words, our IDCG@k=3, considering the first shorter results set is 9.654.
The IDCG@k=5 is 10.515.
We can now divide DCG@k by IDCG@k to obtain the NDCG@k as shown below:
Normalized Discounted Cumulative Gain scores range from 0 to 1, meaning that we can now fairly compare the relative quality of queries even when our result sets differ in length, and we can also see that this metric provides a more intuitive representation of which result set is more relevant.
Determining which RAG evaluation framework is right for you
RAG evaluation frameworks range from proprietary paid solutions to open-source tools. Selecting the right solution requires balancing considerations around ease of maintenance and operational burden, plus how well the metrics observed by the tool map to your Retrieval Augmented Generation pipeline’s use case.
Arize
Arize acts as a model monitoring platform and adapts well to evaluating RAG systems by focusing on Precision, Recall, and F1 Score. It is beneficial in scenarios requiring ongoing performance tracking, ensuring RAG systems consistently meet accuracy thresholds in real-time applications. Arize is a proprietary paid offering providing robust support and continuous updates for enterprise deployments.
ARES
ARES leverages synthetic data and LLM judges, emphasizing Mean Reciprocal Rank (MRR) and Normalized Discounted Cumulative Gain (NDCG). It is ideal for dynamic environments where continuous training and updates are necessary to maintain system relevance and accuracy. ARES is an open-source framework that provides data sets to facilitate getting started.
RAGAS
RAGAS offers streamlined, reference-free evaluation focusing on Average Precision (AP) and custom metrics like Faithfulness. It assesses how well the content generated aligns with provided contexts and is suitable for initial assessments or when reference data is scarce. RAGAS is an open-source tool, allowing for flexible adaptation and integration into diverse RAG systems without the financial overhead of licensed software.
You can read our complete RAGAS tutorial and video with sample code here.
TraceLoop
TraceLoop is an open-source RAG evaluation framework that focuses on tracing the origins and flow of information throughout the retrieval and generation process.
TruLens
TruLens specializes in domain-specific optimizations for RAG systems, emphasizing accuracy and precision tailored to specific fields. It offers detailed metrics to assess retrieval components' domain relevance. TruLens is a proprietary tool for enterprises seeking specialized, high-performance RAG solutions with robust customer support and regular updates to align with evolving domain-specific needs.
You can read our complete TruLens guide, complete with sample code and explanations here.
Galileo
Galileo's RAG tool integrates advanced insights and metrics into users' workflows, focusing on enhancing the performance and transparency of RAG systems. It facilitates easy access to evaluation metrics and simplifies the management of large-scale RAG deployments. Galileo offers its solutions as a proprietary service, which is ideal for businesses seeking comprehensive, scalable AI tools emphasizing usability and commercial application integration.
Ultimately, your selection of evaluation framework will depend on your particular use case, budget, and support needs.
We’ve put together this table to help you determine which solution best maps to your use case:
| Use Case | Recommended Framework | Metrics Used | Reasoning |
|---|---|---|---|
| Initial RAG evaluations | RAGAS | Average Precision (AP), Faithfulness | RAGAS is ideal for initial evaluations, especially in environments where reference data is scarce. It focuses on precision and how faithfully the response matches the provided context. |
| Dynamic, continuous RAG deployments | ARES | MRR, NDCG | ARES uses synthetic data and LLM judges, which are suitable for environments needing continuous updates and training and focusing on response ranking and relevance. |
| Full system traces including LLMs and Vector storage | TraceLoop | Information Gain, Factual Consistency, Citation Accuracy | TraceLoop is best suited for applications where tracing the flow and provenance of information used in the generated output is critical, such as academic research or journalism. |
| Real-time RAG monitoring | Arize | Precision, Recall, F1 | Arize excels in real-time performance monitoring, making it perfect for deployments where immediate feedback on RAG performance is essential |
| Enterprise-level RAG applications | Galileo | Custom metrics, Context Adherence | Galileo provides advanced insights and metrics integration for complex applications, ensuring RAG’s adherence to context. |
| Optimizing RAG for specific domains | TruLens | Domain-specific accuracy, Precision | TruLens is designed to optimize RAG systems within specific domains, by enhancing the accuracy and precision of domain-relevant responses |
Real-world tips on defining “good enough”
When choosing and prioritizing evaluation metrics, it's crucial to consider how they align with your business objectives.
For example, if you primarily value customer satisfaction, prioritize metrics that measure response accuracy and relevance (like MRR or Average Precision) because these directly affect user experience.
We also recommend approaching RAG evaluation iteratively because production RAG pipelines are complex, can involve large amounts of fast-moving data, and can change over time in response to inputs or data store changes:
- Instrument pipelines with metrics for observability
- Monitor and observe performance trends over time
- Iteratively make data-driven improvements to your pipeline
Setting Baselines and Benchmarks
Establish performance benchmarks using metrics such as F1 Score and NDCG, adapting these as your system evolves and more data becomes available.
Balancing Performance with Cost
Evaluating the trade-offs between high metric scores and the associated costs is crucial. High MRR might be targeted but require substantial computational resources in some systems. Balance your need for observability with computational overhead.
Iterative Improvement
Encourage ongoing re-evaluation and refinement of RAG systems. Monitoring tools like Arize can track performance changes over time, facilitating data-driven improvements.
References
[1] Shahul Es, Jithin James, Luis Espinosa-Anke, Steven Schokaert, RAGAS: Automated Evaluation of Retrieval Augmented Generation (2023)
[2] A. Chaudhary, Evaluation Metrics for Information Retrieval (2020)
[3] Y. Wang et al., A Theoretical Analysis of NDCG Ranking Measures (2013), JMLR
Was this article helpful?