Full Observability for Pinecone: Introducing an Open-Source Monitoring Stack for SaaS and BYOC
After working with enough production deployments, a pattern becomes clear: a stale, undersized, or under-resourced index doesn't go down. It returns the wrong results. The problem is that without continuous visibility into index health — record counts, upsert rates, storage utilization, latency trends — there's no signal that anything is wrong until the AI application has already been serving degraded results.
This post introduces pinecone-field/pinecone-monitoring: an open-source stack with pre-built Grafana dashboards, Prometheus metric collection, and support for both Pinecone SaaS (Serverless) and Bring Your Own Cloud (BYOC) deployments.
What's in the Stack
The monitoring solution is built on two industry-standard open-source tools:
Prometheus handles metric collection and time-series storage. It scrapes the Pinecone Metrics API at regular intervals, capturing operational data across all your indexes. For BYOC deployments, it also collects Kubernetes infrastructure metrics via Node Exporter.
Grafana provides the visualization layer — pre-configured dashboards that surface the right data, with built-in alerting capabilities so your team can respond to signals before they become incidents.
The repo supports three deployment configurations:
- SaaS Only: Docker Compose-based setup for teams using Pinecone Serverless. Operational in minutes.
- BYOC Only: Kubernetes-native deployment using Helm charts, with pod-level and node-level infrastructure visibility.
- BYOC + SaaS: A unified monitoring instance that covers both index types simultaneously, ideal for teams running mixed environments.
Why Monitoring a Vector Database Is Different
Monitoring a vector database isn't the same as monitoring a relational database or a REST API. Availability and latency are table stakes; what matters here is the health of high-dimensional index structures, the performance of approximate nearest-neighbor operations, and in BYOC deployments, the Kubernetes layer underneath.
Record counts, upsert rates, and storage utilization tell a different story than uptime alone. A gradual p99 increase over several days might indicate an index approaching a resource ceiling, a shift in query patterns, or a regression from a recent deploy. That signal doesn't exist without time-series data. And unlike databases where a DBA team controls load, Pinecone workloads are shaped by application code, users, and ML pipelines — which makes unexpected changes in operation rates often the first sign something has gone wrong.
What it enables
Proactive operations. Continuous metric collection with Grafana alerting lets teams set thresholds on latency baselines, pod CPU and memory utilization, operation rate deviations, and index storage growth. Issues caught at the signal stage get resolved in minutes; issues caught after users notice get resolved in hours, if not longer.
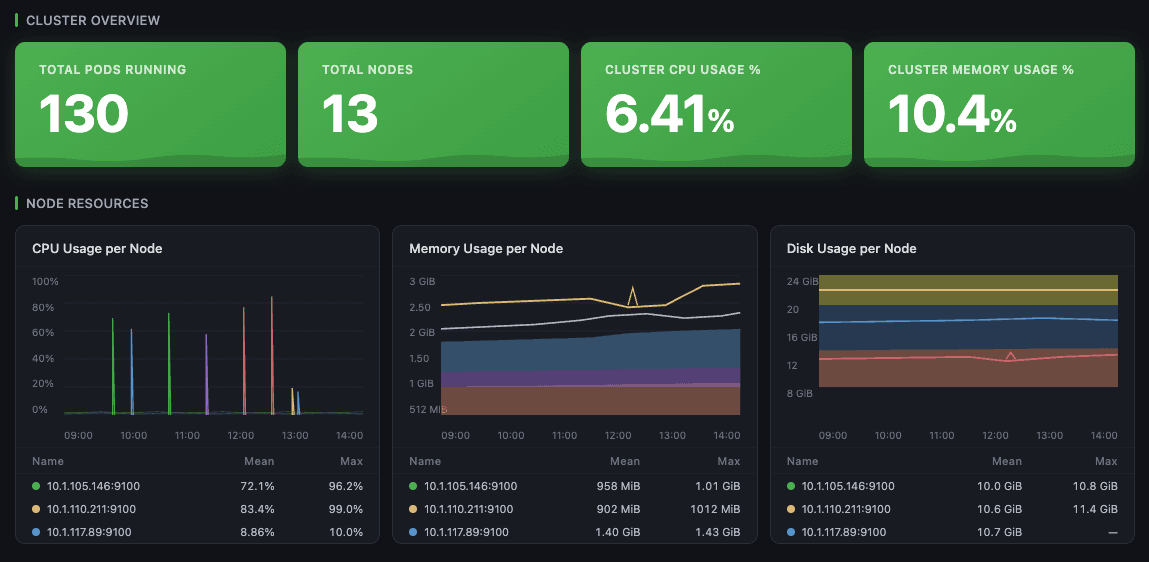
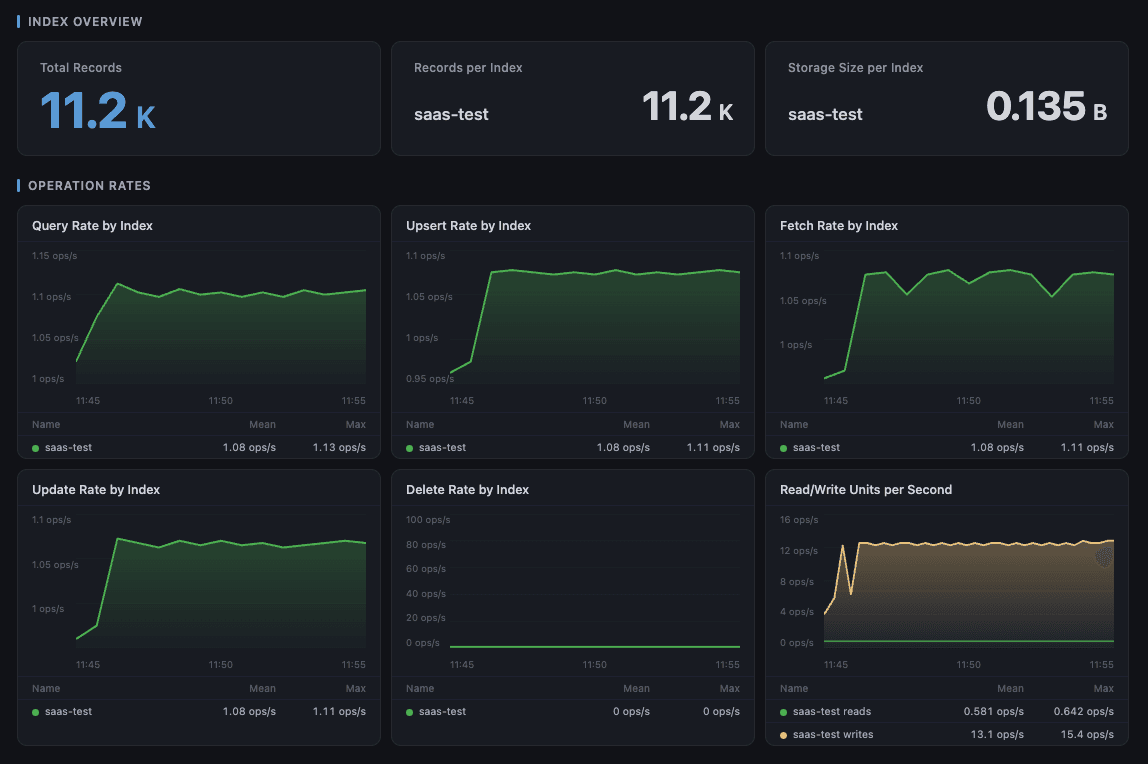
Root cause analysis. When incidents happen, the dashboards provide a complete operational timeline across every Pinecone operation type — queries, upserts, fetches, updates, deletes — with latency at p50 and p99. BYOC deployments add per-pod CPU, memory, and storage alongside Kubernetes node health. Post-incident reviews have data; recurring issues get traced rather than treated.
Workload change detection. AI applications change fast. New model versions, feature launches, and pipeline modifications all shift how Pinecone gets used — sometimes intentionally, sometimes not. A 5x query spike after a feature launch is expected but worth confirming. A background process looping through redundant upserts is invisible without operation rate tracking. A drop in query traffic signaling a broken integration gets caught before users do.
Cost visibility. Pinecone costs are tied to usage. Without visibility into operation rates and storage growth, cost surprises are common. With it, teams can correlate application behavior with usage spikes, identify inefficient patterns, validate that optimizations are actually reducing load, and set alerts before usage hits unexpected thresholds.
Capacity planning. The stack supports infrastructure decisions grounded in trend data rather than incident response. Months of index growth, query volume, and utilization history make it possible to project when a BYOC cluster needs additional nodes, how latency has responded to index growth, and what headroom looks like across pod memory.
Multi-project visibility. The stack supports multiple Pinecone projects in a single deployment. For platform teams managing staging, production, and customer-specific environments, unified visibility makes it straightforward to validate that a deployment change didn't introduce a regression, or that a new environment is performing consistently with an established one.
BYOC infrastructure health. For organizations running BYOC for data residency, compliance, or performance reasons, the stack brings Kubernetes-level observability to Pinecone infrastructure that previously required custom solutions. Pod CPU and memory, node health, filesystem utilization, and storage metrics are all captured and visualized — consistent with the tooling, alerting, and runbooks applied to the rest of the Kubernetes estate.
SLA documentation. Uptime and latency data matter beyond operations. Ninety days of Grafana data supports reliability conversations with business stakeholders, informs SLA commitments, and provides documentation for compliance or audit purposes.
Getting started
For SaaS monitoring, Docker Compose brings up Prometheus and Grafana with pre-configured dashboards in a few minutes. The only prerequisites are a Pinecone API key and project details.
For BYOC, Helm charts deploy the stack into the cluster. Node Exporter is included for infrastructure-level metrics, with deploy and uninstall scripts for lifecycle management.
All dashboards are pre-built and provisioned automatically.
Was this article helpful?