Vector embeddings have proven to be an effective tool in a variety of fields, including natural language processing and computer vision. Comparing vector embeddings and determining their similarity is an essential part of semantic search, recommendation systems, anomaly detection, and much more.
In fact, this is one of the primary determining factors in how Pinecone produces its results. In this article, we will look at three common vector similarity metrics: Euclidean distance, cosine similarity, and dot product similarity. Understanding the benefits and drawbacks of each metric will enable you to make more informed decisions when deciding on the best similarity metric for your use case.
The basic rule of thumb in selecting the best similarity metric for your Pinecone index is to match it to the one used to train your embedding model. For example, the all-MiniLM-L6-v2 model was trained using cosine similarity — so using cosine similarity for the index will produce the most accurate result. If you used a Euclidean distance measure to train your model, the same similarity metric should be used in the index, etc. Pinecone will be able to use the best algorithms as long as we follow this rule.
In this article, we’ll take a deeper look at how these similarity metrics work under the covers to get some intuition as to what it means for two vector embeddings to be similar, in the context of a specific use case. For example, in natural language processing, two vectors representing word meanings may be “close” to one another if they are used in similar contexts or related to similar ideas. In the context of recommendation systems, two vectors representing user preferences can be similar if they share interests or have previously made the same choices.
In the table below, you can see the similarity metrics we’ll discuss in this post and the properties of the vectors that influence the metric.
Table 1: Similarity metrics
| Similarity Metric | Vector properties considered |
|---|---|
| Euclidean distance | Magnitudes and direction |
| Cosine similarity | Only direction |
| Dot product similarity | Magnitudes and direction |
Euclidean distance
Euclidean distance is the straight-line distance between two vectors in a multidimensional space.
Figure 1: Euclidean distance measurement in two dimensions
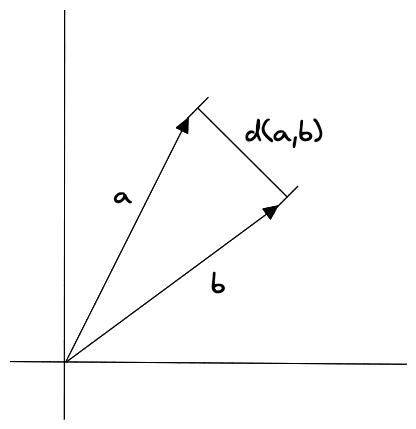
It is computed as the square root of the sum of the squares of the differences between the vectors' corresponding components. Here’s the equation for calculating the Euclidean distance between two vectors a and b:
To calculate the Euclidean distance between two vectors a and b, the equation first calculates the difference between the first components of the two vectors (a1-b1), then the difference between the second components (a2-b2), and so on, until it reaches the nth component (an-bn). The differences are then squared and added together, and the square root of the sum is taken to give the final distance.
This metric is sensitive to scale as well as the vectors' relative location in space. This means that vectors with large values will have a larger Euclidean distance than vectors with small values, even if the vectors are otherwise similar. This can be expressed formally as follows:
Euclidean distance is a very straightforward similarity metric in that it literally reflects the distance between each of the values of the vectors being compared: if the Euclidean distance is very small, then the values of each coordinate in the vectors are very close. This is not true in general for dot product or cosine.
In most cases, you won’t use it with deep learning models but rather with models created with more basic vector encoding methods like LSH (Locality Sensitive Hashing). More generally, Euclidean distance is a natural choice when the model wasn’t trained with a specific loss function.
Since Euclidean distance is sensitive to magnitudes, it is helpful where the embeddings contain information that has to do with counts or measures of things. For example, in a recommendation system where the goal is to recommend items that are similar to a user’s previous purchases: Euclidean distance can be used to measure the absolute difference between the embeddings of the times an item was purchased.
Dot product Similarity
The dot product similarity metric for two vectors is calculated by adding the products of the vectors' corresponding components. The dot product for vectors a and b is calculated as follows:
where a and b are the vectors being compared and ai and bi are the components of the vectors. The dot product is calculated by multiplying the vector components and adding the results.
As shown below, the dot product can also be expressed as the product of the magnitudes of the vectors and the cosine of the angle between them:
Figure 2: Dot product measurement in two dimensions
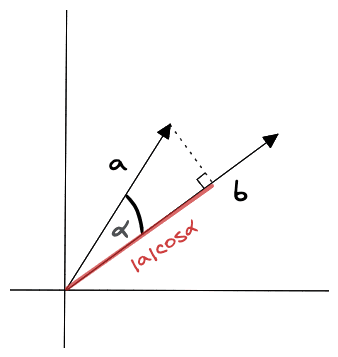
The dot product is a scalar value, which means it is a single number rather than a vector. The dot product is positive if the angle between the vectors is less than 90 degrees, negative if the angle between the vectors is greater than 90 degrees, and zero if the vectors are orthogonal.
The dot product can be affected by the length and direction of the vectors. When two vectors have the same length but different directions, the dot product will be larger if the two vectors are pointing in the same direction and smaller if they are pointing in opposite directions. imagine two vectors represented by arrows, vector a and vector b. If vectors a and b are pointing in the same direction as each other, the dot product of a and b will be larger than if a and b were pointing in opposite directions.
You’re likely to run into many Large Language Models (LLMs) that use dot product for training and as we stated before, the rule of thumb would be to use dot product as the similarity metric for your Pinecone metric. For example, the msmarco-bert-base-dot-v5 model on Hugging Face specifies the “suitable scoring functions” to be only dot product.
In a recommender system based on collaborative filtering and matrix factorization, every user and every item (e.g. movie) has an embedding, and the model is learned such that the dot product between a user embedding and an item embedding is a good predictor of the rating that user will assign this item. Now, if two products have embeddings with the same direction but different magnitudes, this can mean that the two products are about the same topic, but the one that has a larger magnitude is just better / more popular than the other.
Cosine Similarity
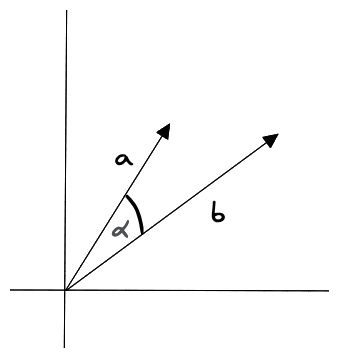
Cosine similarity is a measure of the angle between two vectors. It is computed by taking the dot product of the vectors and dividing it by the product of their magnitudes. This metric is not affected by the size of the vector but only by the angle between them. This means that vectors with large or small values will have the same cosine similarity as long as they point in the same direction. Here’s how cosine similarity is calculated for vectors a and b:
where a and b are the vectors being compared, “•” stands for the dot product, and ||a|| and ||b|| stand for the vectors' lengths. The cosine similarity is between -1 and 1, where 1 means an angle of 0 (vectors are as close as they can be), 0 means orthogonal, and -1 means that the vectors are pointing in opposite directions.
Figure 3: Cosine similarity measurement in two dimensions
First, the equation calculates the dot product of the vectors by multiplying their components and adding the results. The dot product is then divided by the product of the magnitudes of the vectors, which is calculated by taking the square root of the sum of the squares of the components of the vectors.
If the model was trained using cosine similarity, you either use cosine similarity or normalize and use dot product. Note that options are mathematically equivalent. In some cases normalizing and using the dot product is better, and in some cases where using cosine similarity is better.
An example use case for cosine similarity is solving semantic search and document classification problems since it allows you to compare the direction of the vectors (i.e., the overall content of the documents). Similarly, recommendation systems that aim to recommend items to users based on their past behavior could use this similarity metric.
Cosine similarity is probably not suitable when you have data where the magnitude of the vectors is important and should be taken into account when determining similarity. For example, it is not appropriate for comparing the similarity of image embeddings based on pixel intensities.
Wrap-Up
Remember the general principle we mentioned in the introduction of this post when selecting the similarity metric for your index: use the same similarity metric that was used to train your embedding model. Otherwise, you should experiment with various other similarity metrics to see if you can produce even better results (for instance, if you don’t know what similarity metric was used in the embedding mode or if the method the vectors were created with does not have such a metric in the generation process ).
Was this article helpful?