Test Pinecone Serverless at Scale with the AWS Reference Architecture
Let's stress test Pinecone Serverless!
Many vector database offerings are available today, but only Pinecone was designed from the ground up to be the most performant cloud-native vector database on the market. But you don’t need to take our word for it.
After reading this post, you’ll have the knowledge, open-source code and step-by-step instructions you need to deploy a high-scale distributed system that uses Pinecone to perform semantic search at an arbitrary scale.
We’ll demonstrate how to generate arbitrary load on this system by generating additional sample records for the system to process, using provided utilities in the open-source repository.
The only caveat to be aware of is your AWS bill - we will show you how to generate and move millions of records through the system, so keep an eye on your AWS costs when you’re flexing Pinecone.
With the recent release of Pinecone Serverless, there’s no better time to use the Reference Architecture to experiment with various high-scale scenarios, especially because Pinecone is giving everyone $100 in Serverless credits when you sign up. Let’s get started!
What is the Pinecone Reference Architecture?

The Pinecone AWS Reference Architecture with Pulumi is a production-ready example of a non-trivial distributed system that leverages Pinecone at scale.
It is designed to serve:
- As a production example, that is fully deployable, fork-able, modifiable, and permissively licensed. You can use the Reference Architecture to deploy your company’s next project.
- As a reference for seeing how we tackled certain problems and how we think about deploying AI applications to production
- As a test bed for high-scale production scenarios. You can generate arbitrary load, test your workloads at scale, and tune and tweak our various configurations to get the ideal throughput and user experience for your application
Getting up to speed with the Pinecone Reference Architecture
We’ve got several resources to help you understand and get started with the Reference Architecture:
- The GitHub repository, which hosts the code and documentation
- Our launch announcement, which provides an overview
- Our technical walkthrough, which examines the components
- YouTube video series (walkthroughs of deployment, tear down, and common tasks)
The system at a glance
First, we’ll briefly explain what this production example entails and the patterns it demonstrates.
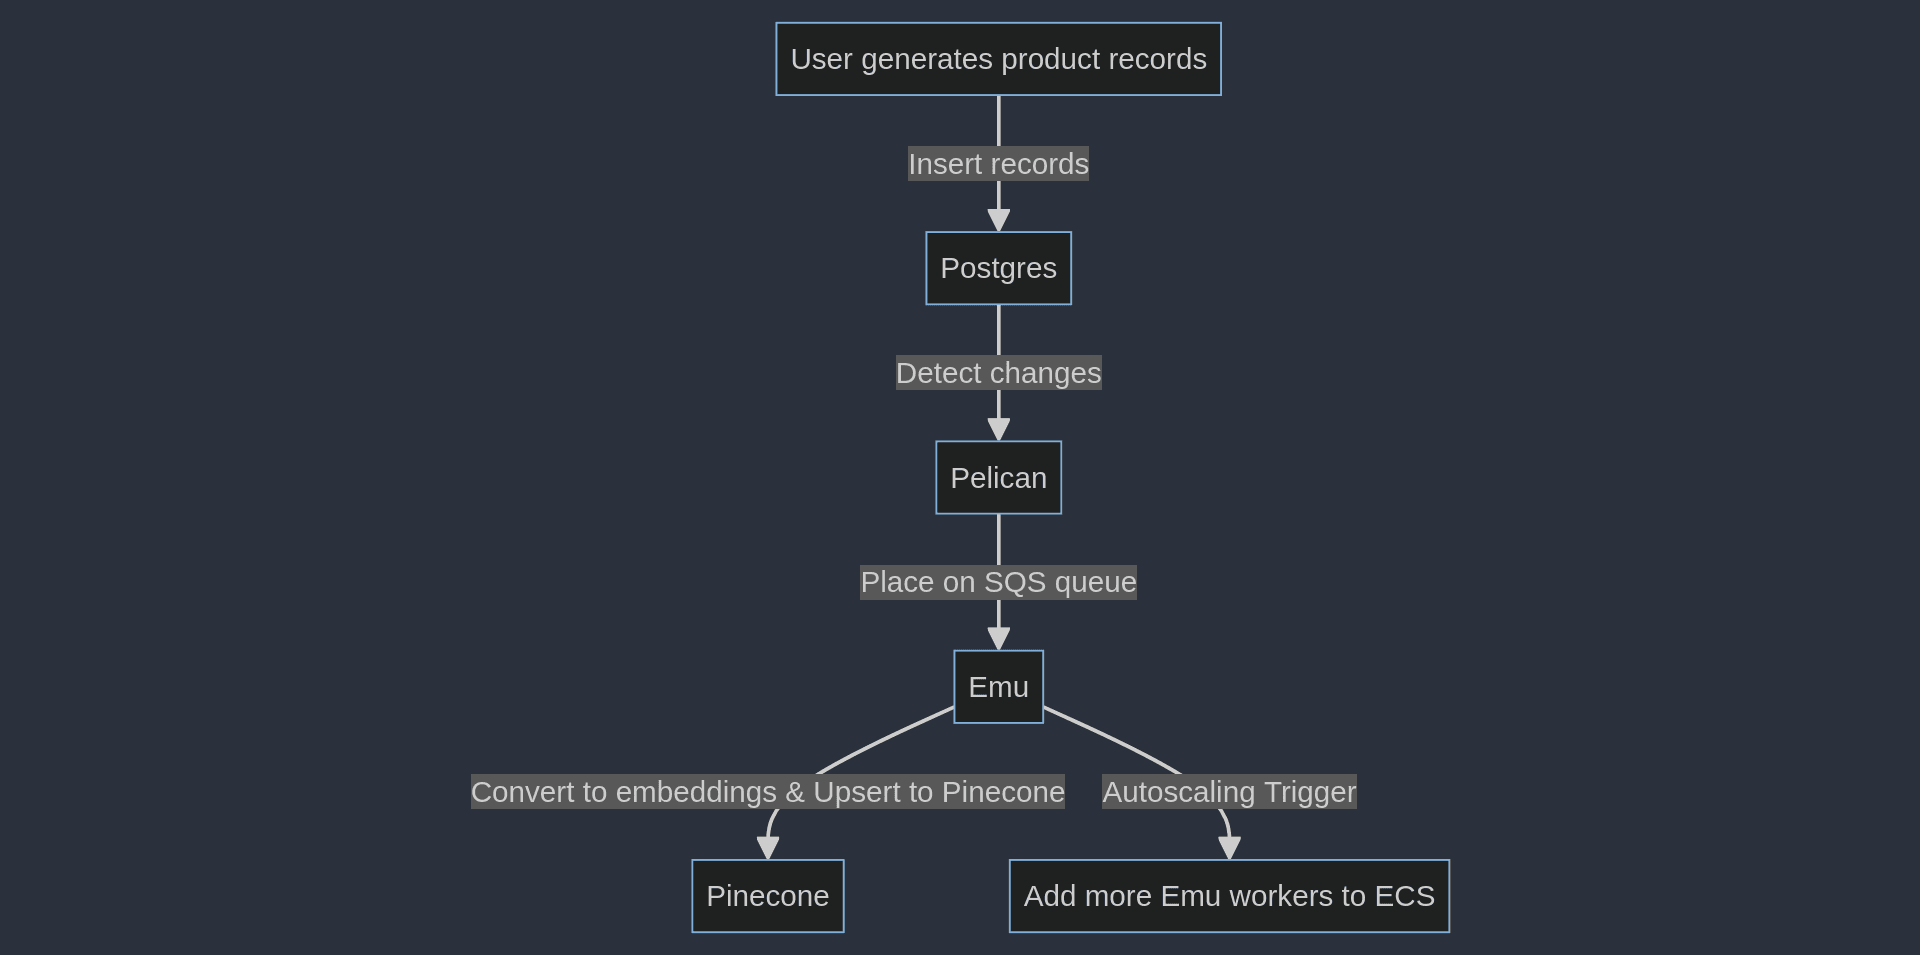
The Reference Architecture exposes a live-editable search and table user interface populated with fake products stored in a PostgreSQL database.
The search bar at the top allows users to issue queries in ambiguous, natural language, such as “Products using AI” or “Eco-friendly offerings that are electric.”
This semantic search is made possible via Pinecone’s vector database. The Reference Architecture converts its initial data set of fake products to embeddings that it upserts into the associated Pinecone index when the system is first deployed.
This also means that any changes the user makes, or any new records introduced into the PostgreSQL database, must be efficiently converted to embeddings and upserted into the Pinecone index so that the system stays fully in sync.
This is the essential workflow the Pinecone AWS Reference Architecture demonstrates.
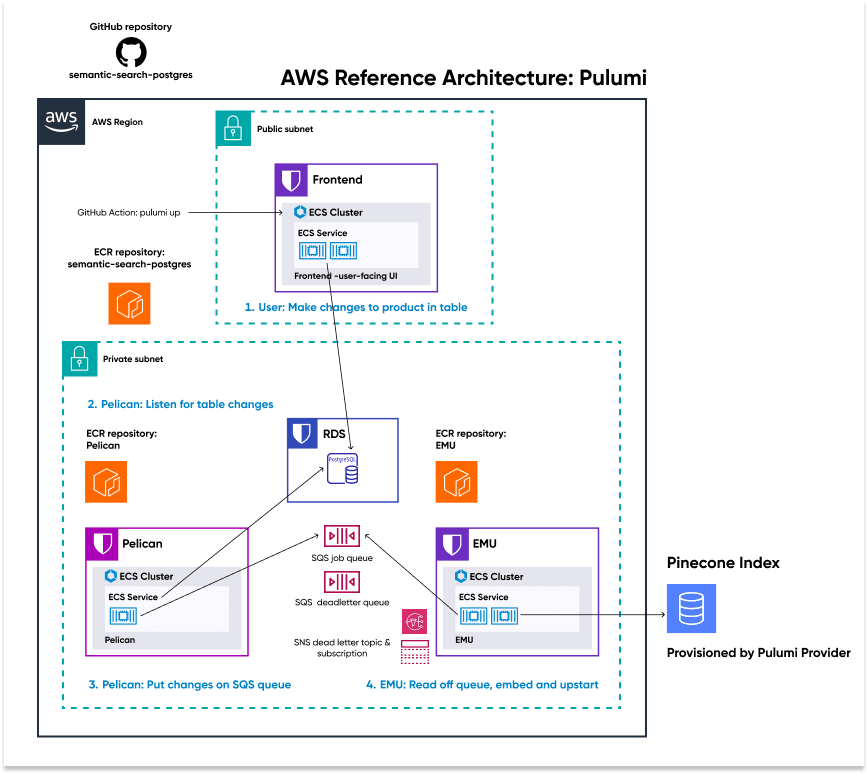
As you can see in the architecture diagram above, we manage this perpetual syncing with three separate microservices and a shared SQS jobs queue:
- The Frontend microservice exposes the user interface application to the end user via a load balancer
- The “Pelican” microservice listens to the PostgreSQL database for any changes and places those changed records on the SQS jobs queue.
- The “Emu” microservice pulls these changes in product descriptions off the queue, converts them to embeddings, and upserts them into the Pinecone index.
This pattern is powerful, especially when combined with additional on-demand capacity for worker pools that cloud providers such as AWS offer.
The Pelican and Emu microservices have autoscaling policies configured, which automatically provision additional workers as needed, so the system remains nimble to workload changes.
Combine this with Pinecone Serverless, which scales effortlessly without requiring you to specify the shape or size of your workloads upfront, and you've got the makings of an infinitely scalable distributed system.
Deploying the Reference Architecture
You can either read this article to understand how to scale the Reference Architecture, or you could deploy your instance to follow along and complete the same steps for a more hands-on approach.
The easiest way to deploy the Reference Architecture is to visit the repository and follow the QuickStart guide we’ve created for you. This guide includes only the steps you need to take to get the system fully deployed, which takes about 15 minutes or less.
You could also look at the official Pinecone YouTube playlist for the Reference Architecture, which provides a complete walkthrough of deploying, destroying, and configuring the system.
Autoscaling policies
In Pinecone’s AWS Reference Architecture, the autoscaling behavior of the Pelican and Emu microservices is managed by their autoscaling policies.
Autoscaling policies in AWS work in concert with CloudWatch alarms under the hood and are very flexible.
Our defined policies aim to be generic enough to be demonstrative and helpful, but they are not meant as hard rules. One of the reasons we elected to use Infrastructure as Code (IaC) via Pulumi for this project is to enable you to make and deploy changes to the system. You can tweak and modify the policy configuration to your use case and needs, run pulumi up , and have your changes reflected in your running system.
For example, you can have your autoscaling policies trigger off the average CPU usage of your ECS service or the average queue depth for each worker.
When defining an autoscaling policy, we specify the targetValue for the metric we’ve chosen to observe to determine if it’s time to scale out.
To keep things simpler, and because it works well in practice, we set the Pelican microservice’s autoscaling policy to trigger scale-out to keep most of the Pelican workers’ CPU usage at 25%:
const pelicanCpuUtilizationPolicy = new aws.appautoscaling.Policy(
  "pelicanCpuUtilizationPolicy",
  {
    policyType: "TargetTrackingScaling",
    resourceId: pelicanEcsTarget.resourceId,
    scalableDimension: pelicanEcsTarget.scalableDimension,
    serviceNamespace: pelicanEcsTarget.serviceNamespace,
    targetTrackingScalingPolicyConfiguration: {
      targetValue: 25, // Target CPU utilization percentage
      predefinedMetricSpecification: {
        predefinedMetricType: "ECSServiceAverageCPUUtilization",
      },
      scaleInCooldown: 30,
      scaleOutCooldown: 30,
    },
  },
);
We also define a scaleInCooldown and scaleOutCooldown. These values specify how soon, after an autoscaling event, a new one can be triggered. Keeping these values low helps your system detect changes in workload more quickly.
The Emu worker’s autoscaling policy is configured in the same way, but if you wanted to trigger scaling events based on the approximate number of messages each worker would need to process, you could accomplish that with some metric math:
const example = new aws.autoscaling.Policy("example", {
    autoscalingGroupName: "my-test-asg",
    policyType: "TargetTrackingScaling",
    targetTrackingConfiguration: {
        customizedMetricSpecification: {
            metrics: [
                {
                    id: "m1",
                    label: "Get the queue size (the number of messages waiting to be processed)",
                    metricStat: {
                        metric: {
                            dimensions: [{
                                name: "QueueName",
                                value: "my-queue",
                            }],
                            metricName: "ApproximateNumberOfMessagesVisible",
                            namespace: "AWS/SQS",
                        },
                        stat: "Sum",
                    },
                    returnData: false,
                },
                {
                    id: "m2",
                    label: "Get the group size (the number of InService instances)",
                    metricStat: {
                        metric: {
                            dimensions: [{
                                name: "AutoScalingGroupName",
                                value: "my-asg",
                            }],
                            metricName: "GroupInServiceInstances",
                            namespace: "AWS/AutoScaling",
                        },
                        stat: "Average",
                    },
                    returnData: false,
                },
                {
                    expression: "m1 / m2",
                    id: "e1",
                    label: "Calculate the backlog per instance",
                    returnData: true,
                },
            ],
        },
        targetValue: 100,
    },
});
These autoscaling policies are defined as code in index.ts in the Reference Architecture repository.
How to scale up the Reference Architecture
Now that we understand the autoscaling policies and how they work, we will create additional fake product records and insert them into the PostgreSQL database to generate a ton of work for the system to process.
To do that, we’ll first deploy a Jump host that we can use to access private infrastructure such as our RDS PostgreSQL database.
Step 1. Deploy a Jump host
The Reference Architecture's VPC divides resources into public and private subnets for security reasons. The frontend UI microservice runs in the public subnet, and everything else, including the RDS Postgres database and the backend microservices, runs in the private subnet.
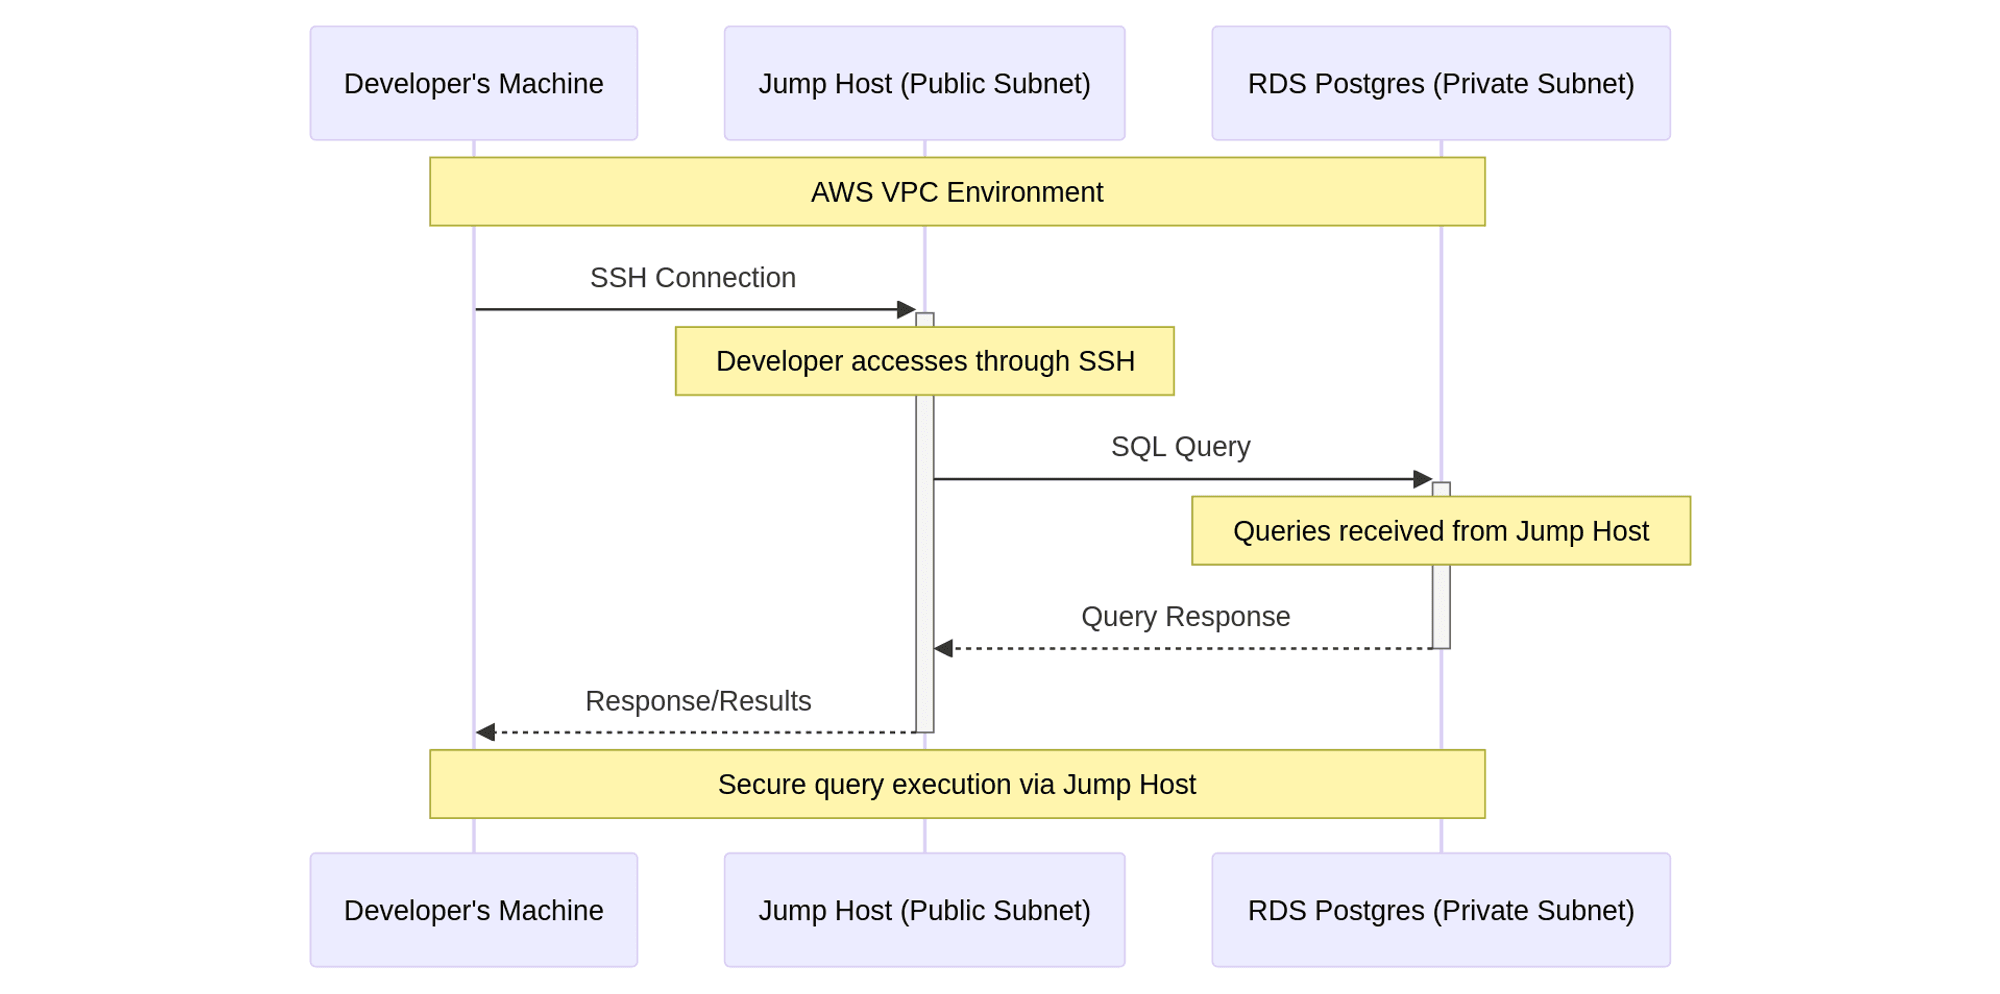
Resources running in the private subnets are not directly accessible via the public internet by design.
Therefore, to query the database directly or perform any other tasks that require direct access to the backend, you must connect through a "jump" or bastion host that runs in the public subnet but has access to private resources.
At a high level, this involves launching a new EC2 instance into the public subnet and granting its security group access to the RDS Database by adding an inbound rule allowing traffic from the jump host's security group into the RDS Postgres database's security group.
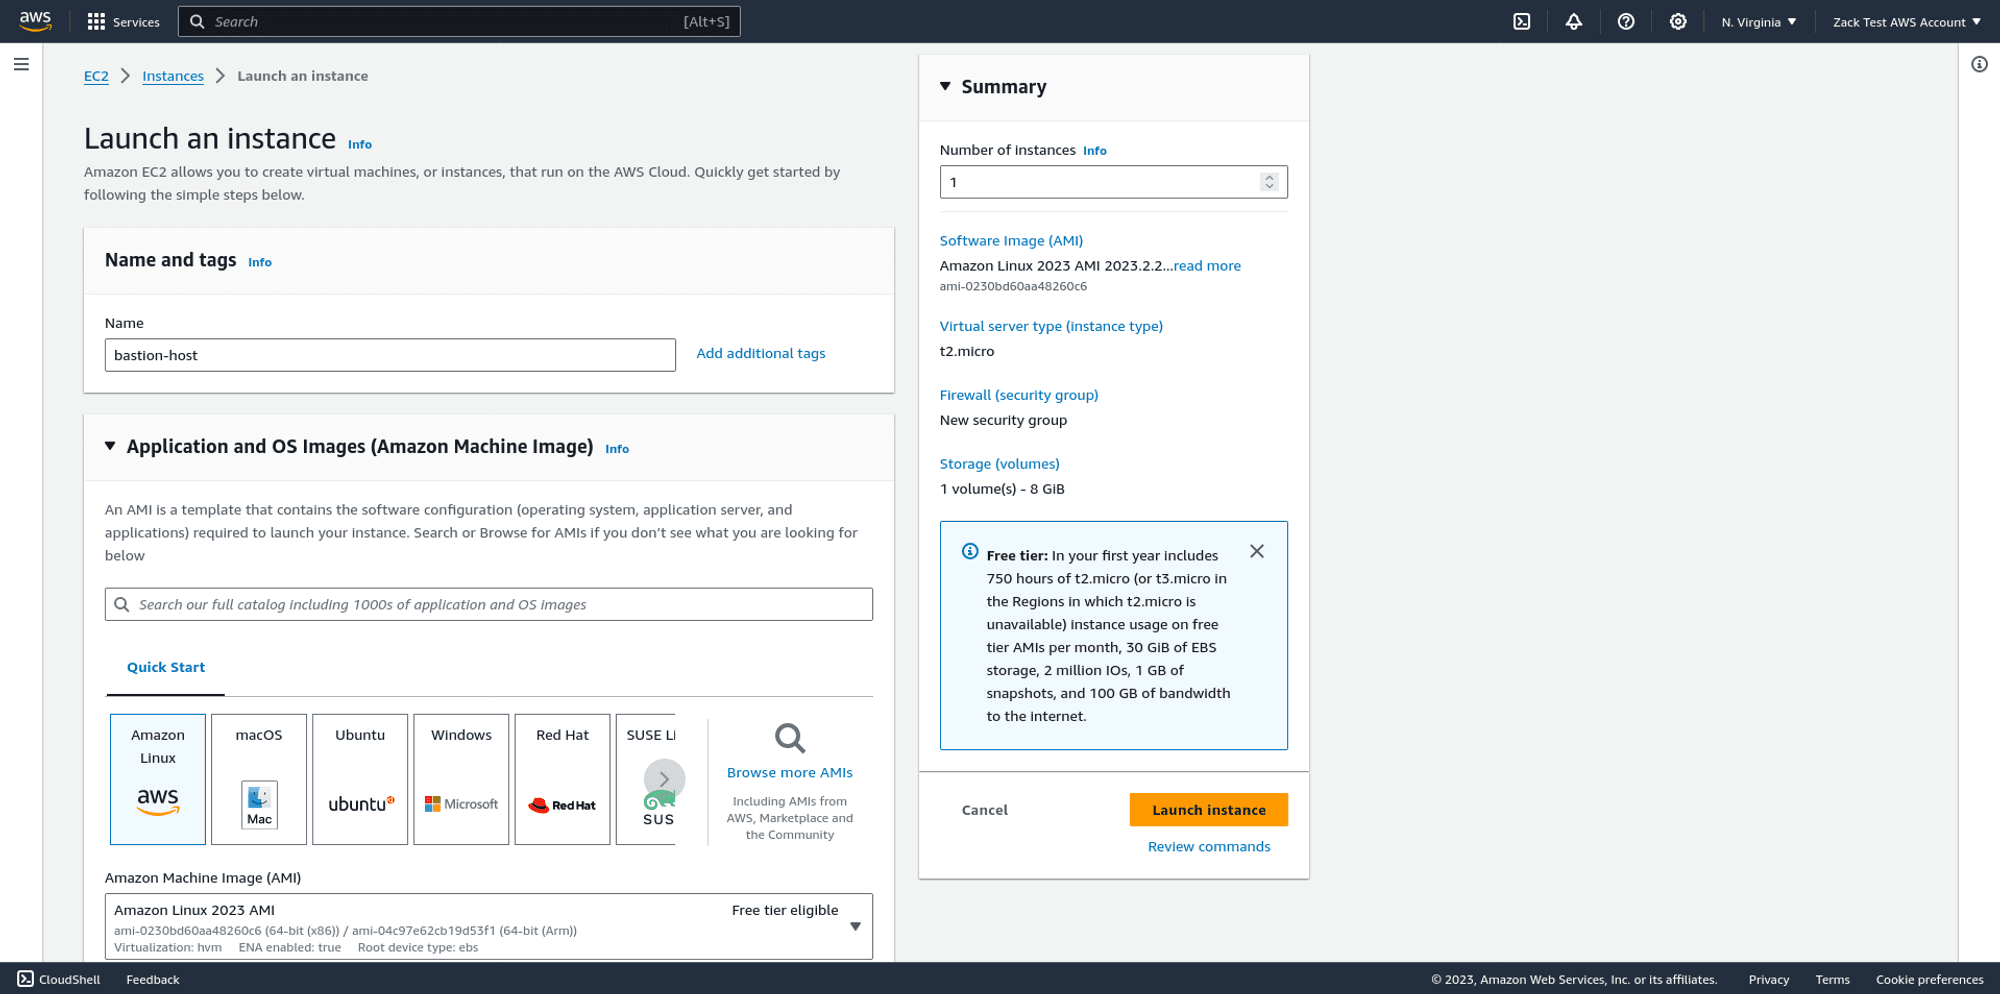
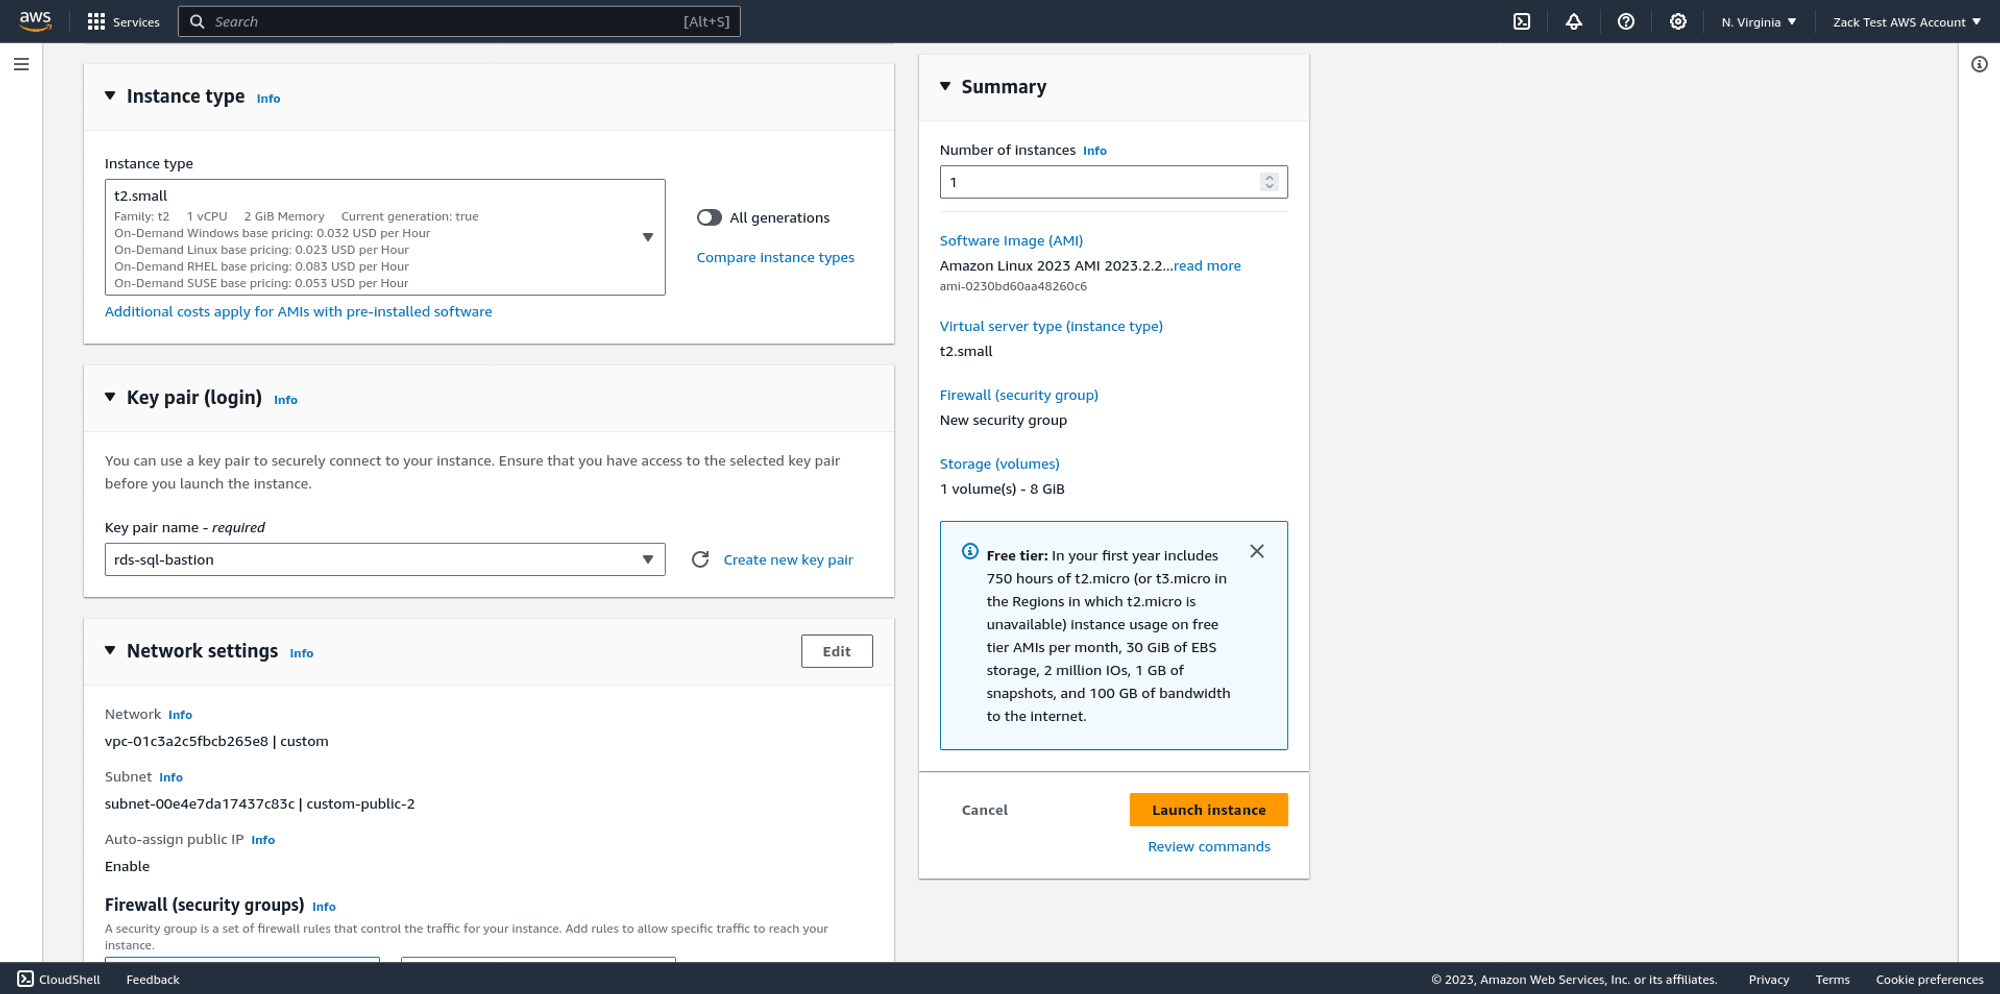
On the EC2 dashboard, choose Launch an instance. Choose the default Amazon Linux flavor and the recommended Amazon Machine Image (AMI).
Ensure that your jump host:
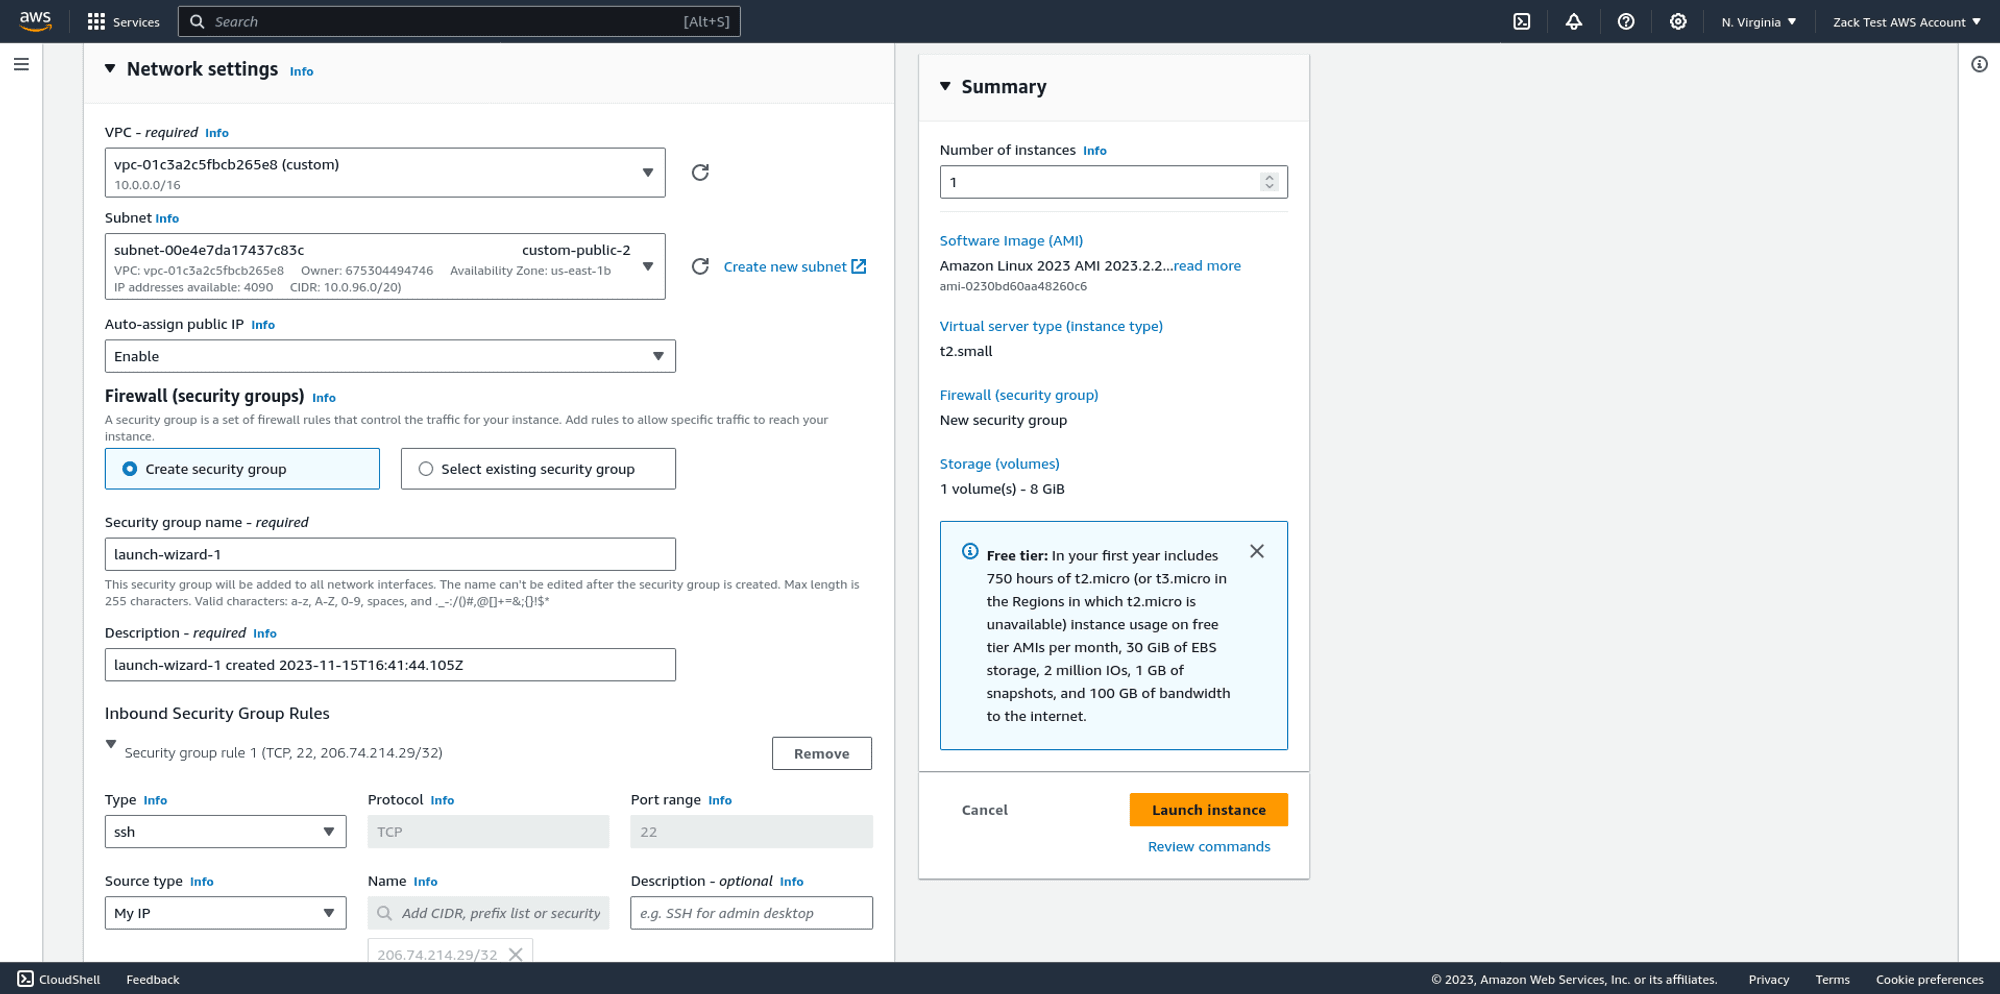
- will be launched into the same VPC that your Reference Architecture deployed
- will be launched in one of your VPC's public subnets
- will automatically have a public IPv4 address assigned to it
- will be launched into a new security group. You can accept the default suggestion for the name
Create a new SSH keypair, if you don't already have one, and choose .pem format.
When you create a new keypair, the AWS web console will force download the private key to your machine. Check your downloads folder, and run the following command to ensure the correct permissions on your key, otherwise, your SSH client will complain:
chmod 400 ~/Downloads/<your-private-key>.pem
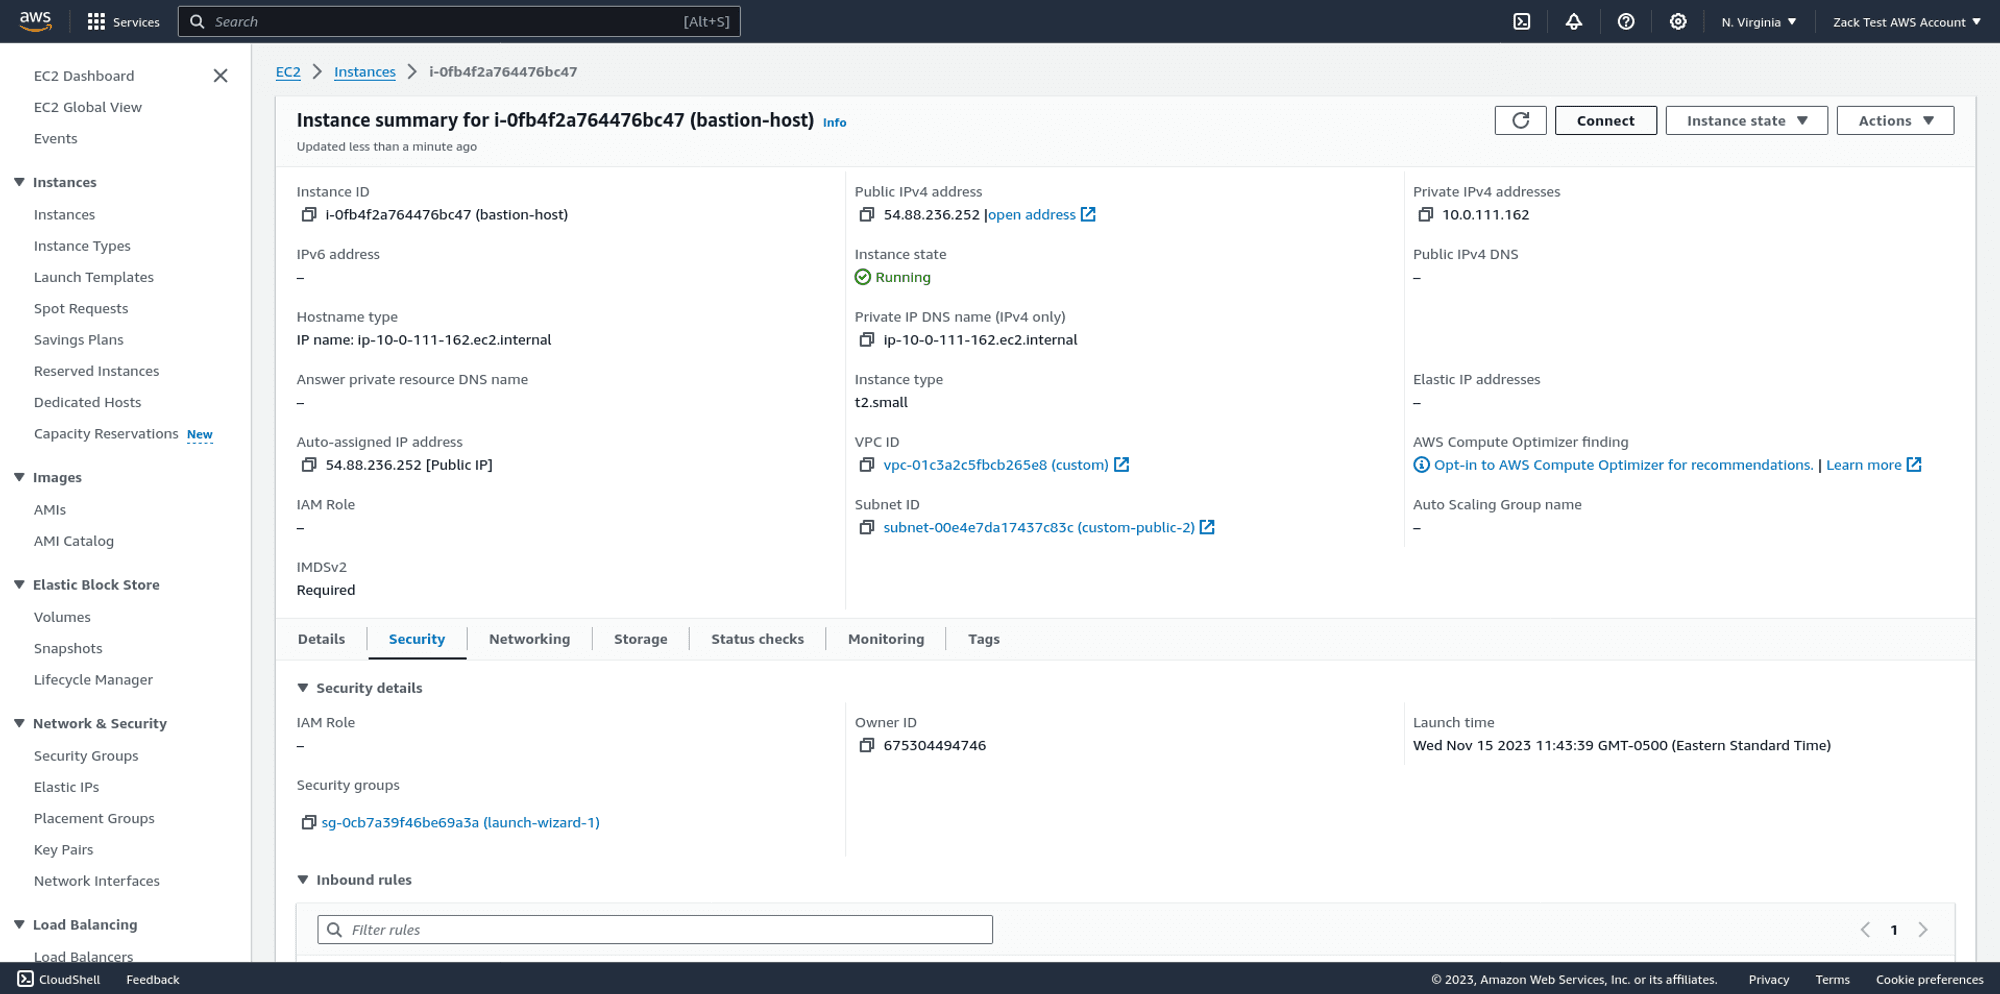
Launch your instance and wait a few moments for its status to change to Available:
Ensure your SSH configuration is working properly by connecting to your jump host over SSH:
ssh -i ~/Downloads/<your-private-key>.pem ec2-user@<your-jumphost-public-ipv4-address>
If your attempt is successful, you should see similar output in your terminal:
,     #_
   ~\\_  ####_        Amazon Linux 2023
  ~~  \\_#####\\
  ~~     \\###|
  ~~       \\#/ ___   <https://aws.amazon.com/linux/amazon-linux-2023>
   ~~       V~' '->
    ~~~         /
      ~~._.   _/
         _/ _/
       _/m/'
[ec2-user@ip-10-0-41-54 ~]$
Step 2. Grant your jump host access to resources running in the backend
The RDS Postgres database is running in its own security group. By design, this security group only grants access to:
- the frontend microservice's security group because the frontend issues database queries
- the pelican microservice's security group because Pelican listens to the Postgres database for changes
To allow your jump host to access the Postgres RDS database directly, to give yourself direct access via tools like psql, you must first look up the ID of the security group that was created for your jump host when you launched it:
Once you know the ID of your jump host's security group, go to the EC2 dashboard > Security groups and find the RDS Security group.
Edit the RDS security group and add a new inbound rule. For the protocol, set PostgreSQL, which automatically allows access via port 5432.
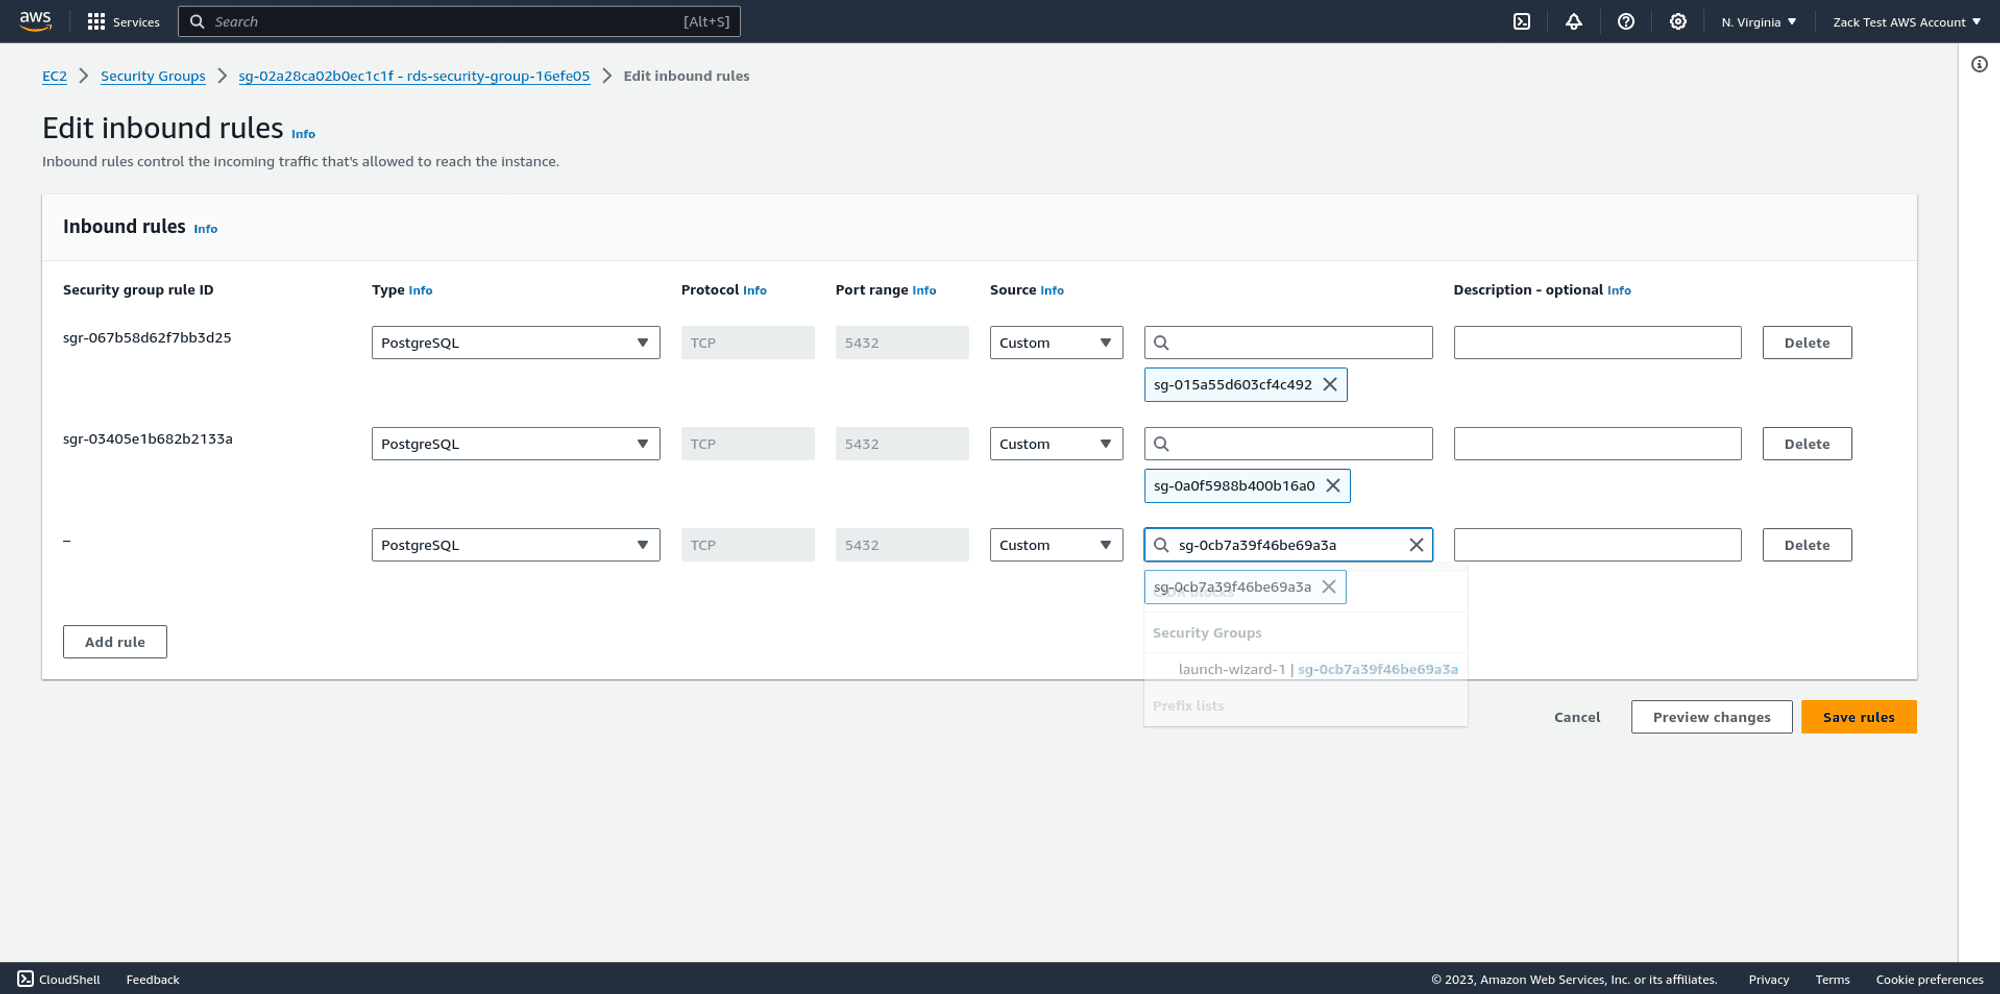
Once you save the RDS Postgres security group's inbound rules, your jump host should have access to the RDS Postgres database, allowing you to run commands from an SSH session to your jump host.
Step 3. Install the Postgres client on the jump host
SSH to your jump host:
ssh -i ~/Downloads/<path-to-your-ssh-private-key>.pem ec2-user@<your-jump-host-ipv4-address>
Next, search for the latest PostgreSQL package using the yum package manager:
sudo yum update
sudo yum search "postgres"
You will see output similar to the following:
[ec2-user@ip-10-0-41-54 ~]$ sudo yum search postgres
Last metadata expiration check: 0:04:31 ago on Fri Jan 19 18:20:50 2024.
============================================================================== Name & Summary Matched: postgres ==============================================================================
collectd-postgresql.x86_64 : PostgreSQL plugin for collectd
postgresql-odbc.x86_64 : PostgreSQL ODBC driver
postgresql15.x86_64 : PostgreSQL client programs
postgresql15-contrib.x86_64 : Extension modules distributed with PostgreSQL
postgresql15-docs.x86_64 : Extra documentation for PostgreSQL
postgresql15-llvmjit.x86_64 : Just-in-time compilation support for PostgreSQL
postgresql15-plperl.x86_64 : The Perl procedural language for PostgreSQL
postgresql15-plpython3.x86_64 : The Python3 procedural language for PostgreSQL
postgresql15-pltcl.x86_64 : The Tcl procedural language for PostgreSQL
postgresql15-private-devel.x86_64 : PostgreSQL development header files for this build of PostgreSQL server
postgresql15-private-libs.x86_64 : The shared libraries required only for this build of PostgreSQL server
postgresql15-server.x86_64 : The programs needed to create and run a PostgreSQL server
postgresql15-server-devel.x86_64 : PostgreSQL development header files and libraries
postgresql15-static.x86_64 : Statically linked PostgreSQL libraries
postgresql15-test.x86_64 : The test suite distributed with PostgreSQL
postgresql15-test-rpm-macros.noarch : Convenience RPM macros for build-time testing against PostgreSQL server
postgresql15-upgrade.x86_64 : Support for upgrading from the previous major release of PostgreSQL
Find and install the latest PostgreSQL package, (for example at the time of writing): sudo yum install -y postgresql15.x86_64
Step 4. Generate product records
The Reference Architecture contains utilities to aid you in the creation of additional product records that you can insert into Postgres to increase system load:
There is a helper tool in helpers/generate_records.go that you can run to generate an arbitrary number of records in a format that the default Reference Architecture expects.
If you open that file, you'll find two consts at the top that control its behavior:
const (
	numRecords   = 1000000
	productsFile = "one_million_products.csv"
)
You can modify these two const variables to change the number of records or the destination file they'll be written to.
However, be aware that moving many millions of messages through your Reference Architecture will incur additional AWS charges.
To run the helper and generate the records, you must have Golang installed. Run the following command in the same directory as the generate_records.go file:
go run generate_records.goYou should now have a file named one_million_products.csv in the same directory or a .csv file of whatever custom name you provided if you edited the productsFile variable.
Now, we will move this file onto our jump host and then use psql to load it into our Postgres database.
Step 3. Use SCP to transfer files from your machine to the jump host
Replace the IP address in the following command with the IPv4 address of your jump host, then run this command from a new terminal session on your local machine:
scp -i ~/Downloads/rds-sql-bastion.pem ~/<your-path>/one_million_products.csv ec2-user@54.88.236.252:/home/ec2-user/one_million_products.csvThis will upload your one_million_products.csv file to the ~/ec2-user directory on your Jump host.
Step 4. Connect to the Postgres database from the jump host
Visit the RDS page in the AWS console. Find the RDS Postgres database and copy its hostname from the overview panel:
Here's an example command for connecting from your jump host to your RDS Postgres database:
psql -h mydb0e0dbc2.c4ztncw5rxvr.us-east-1.rds.amazonaws.com -U postgres
If everything works, you'll next be prompted for the password, which is AVNS_UhAVnXgK9zFnxOH1-Hj.
The password is the same for all users because the RDS Postgres database uses a public snapshot that already has the password configured.
You should now be greeted with the PostgreSQL prompt, allowing you to issue arbitrary SQL.
postgres=#
Step 5. Use psql to insert the generated products to Postgres
From the terminal session where you’re already connected to your Jump host, run the following command to load the CSV records into your Postgres database:
\copy products_with_increment(name, sku, description, price, last_updated) FROM './one_million_products.csv' WITH (FORMAT csv, HEADER true, DELIMITER ',');Step 6. Re-deploy the Pelican microservice
In this scenario, we’re effectively deploying a second wave of data to the Reference Architecture after the initial data bootstrapping phase.
Therefore, we can force a fresh deployment of the Pelican microservice so that the workers perform their initialization routine, realize there are Postgres records that have not yet been processed, and begin shuttling the new product records we’ve generated onto the SQS queue for Emu to pick up.
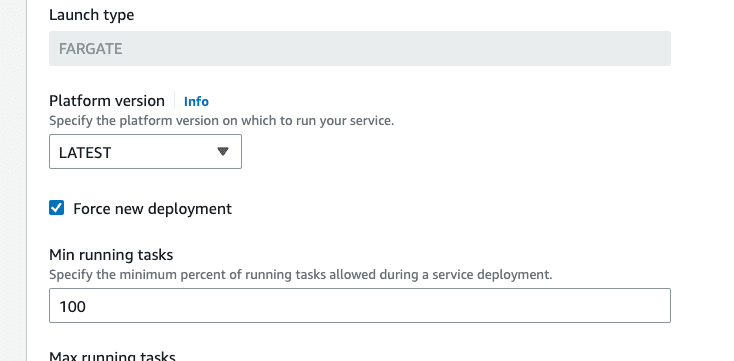
In the AWS web console, visit the ECS panel for the region where you deployed your Reference Architecture, find the Pelican ECS service, click on it and check the Force new deployment checkbox, then click update.
Step 7. Monitor SQS for messages
Once the fresh set of Pelican workers begins waking up, they'll write the new product records to SQS, which you can monitor by visiting the SQS page and clicking “queues”:
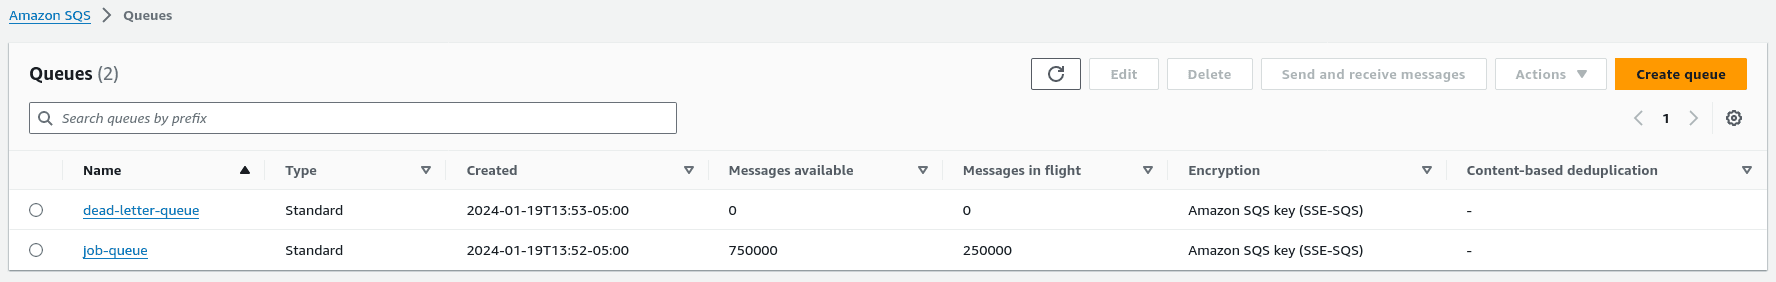
There are two queues in the Pinecone Reference Architecture:
job-queue:Holds changed records from Postgres - written to by Pelican and read from by Emudead-letter-queue: Holds messages that were never successfully retrieved and deleted. A high count here means that something is wrong. You can also optionally subscribe to the associated SNS topic for this dead letter queue to receive an email or SMS alert whenever messages are undeliverable.
The job-queue is the one to pay attention to. The Messages available column refers to the count of messages the queue is currently holding that are awaiting retrieval by Emu.
The Messages in flight column counts the messages currently being processed by Emu, because they have been read from the queue but not yet marked as deleted by the Emu worker after it finished processing them.
The behavior that you should see when you load a large number of test records into Postgres is:
- The Messages available count should spike upward as Pelican loads new records onto the queue
- The Messages in-flight count should spike, more slowly at first, as Emu workers begin reading and processing messages off the queue.
- Shortly, the autoscaling policy for Emu will trigger a scale-out, so you should see additional Emu workers running in your ECS panel under the Emu service.
- At this point, you should begin to see the count of Messages in flight rise as more and more Emu workers come online to help process the work queue.
Step 8. Monitor your autoscaling behavior
Within AWS, the configured Autoscaling policies work with CloudWatch Alarms to determine when it is time to scale out and add more workers or delete excess workers because the overall system load is low. You can view all the alarms defined on the CloudWatch alarms index page:
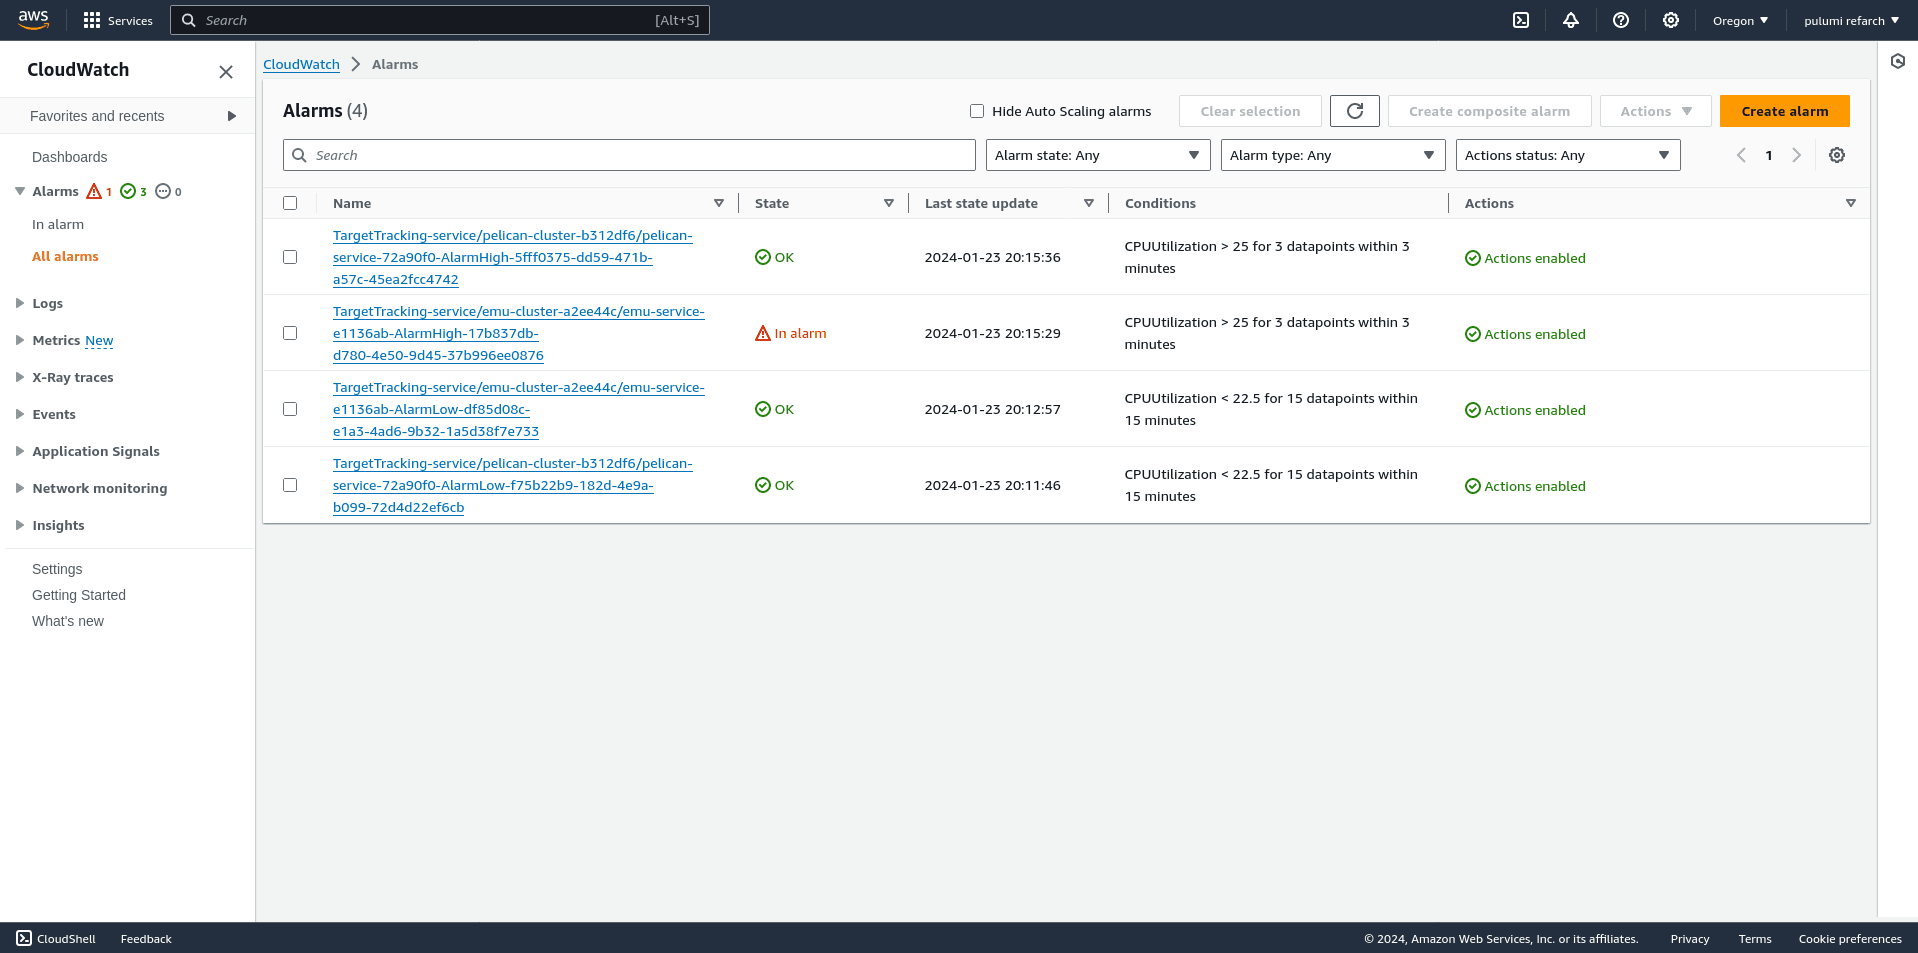
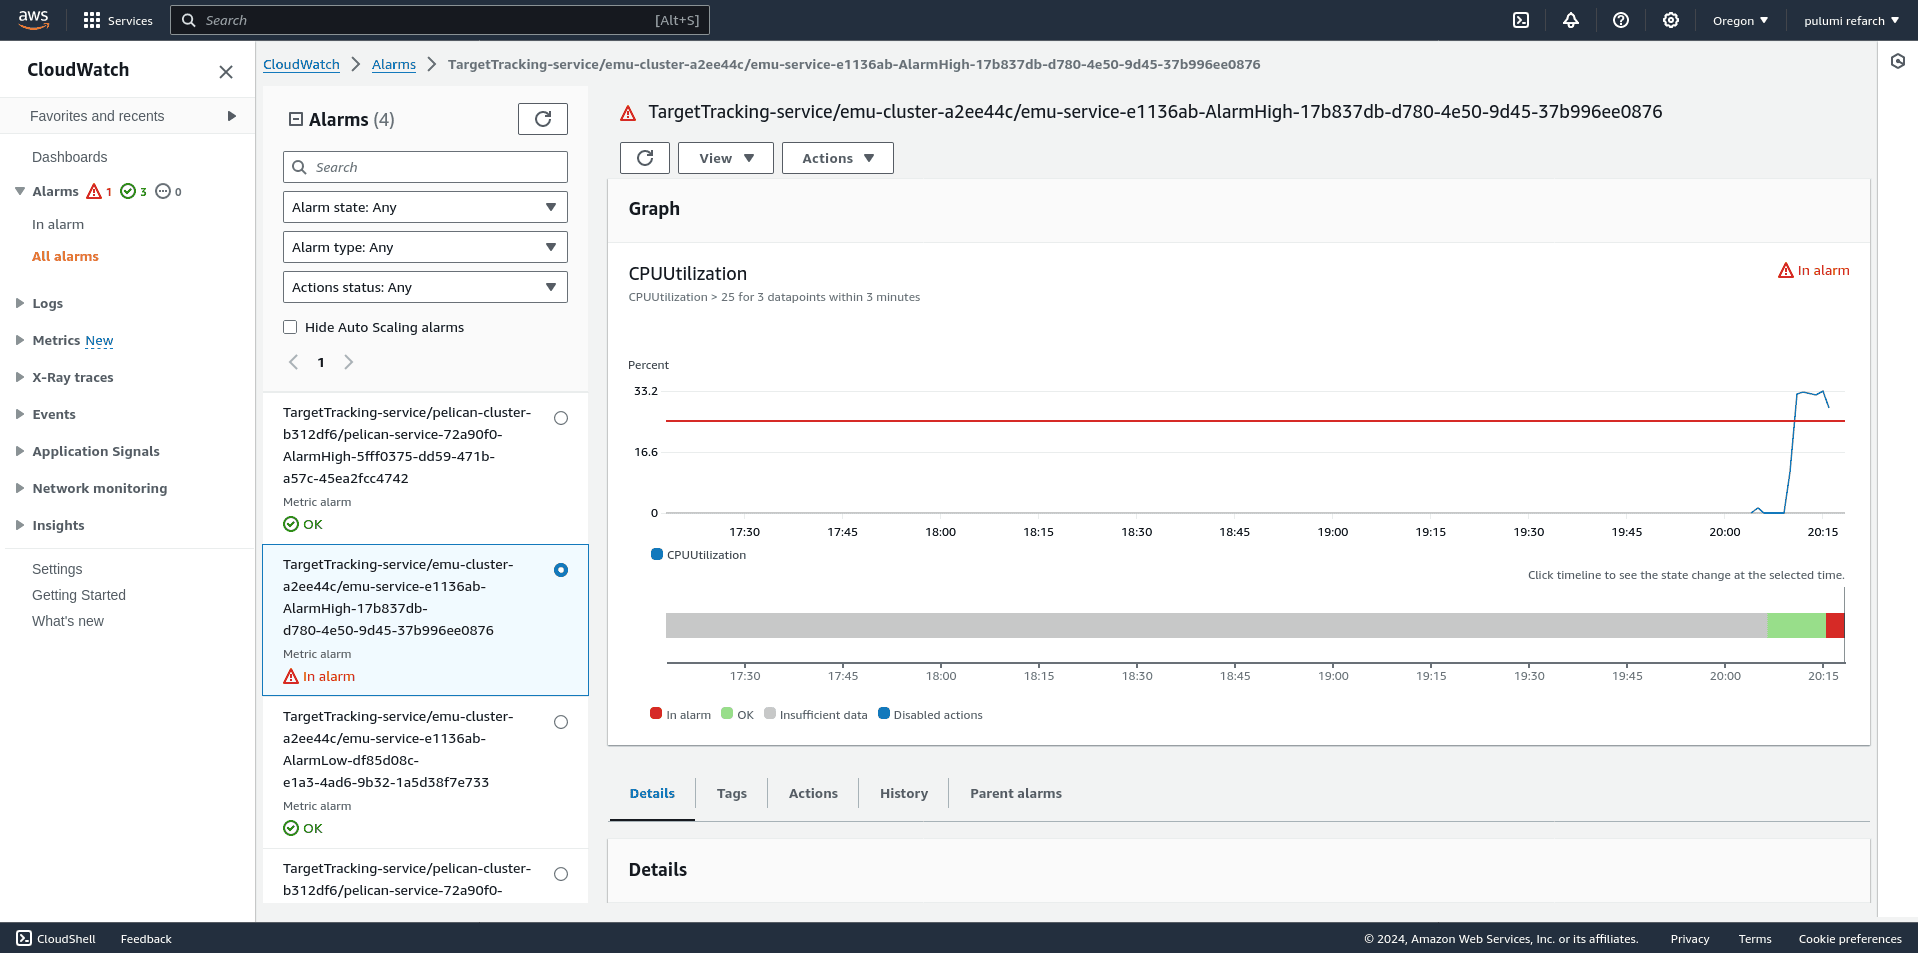
Each of these alarms has two states: In Alarm and OK. When a configured threshold or condition is reached, the Alarm enters the In Alarm state, at which point AWS’s autoscaling services determine the actions to take to keep resources at their configured usage watermarks.
For example, here’s an Emu autoscaling alarm in the In Alarm state, meaning that additional Emu workers are needed to handle increasing queue pressure:
To connect the dots, now view the associated ECS service to see how its worker count and event history reflect scale out and scale in events:
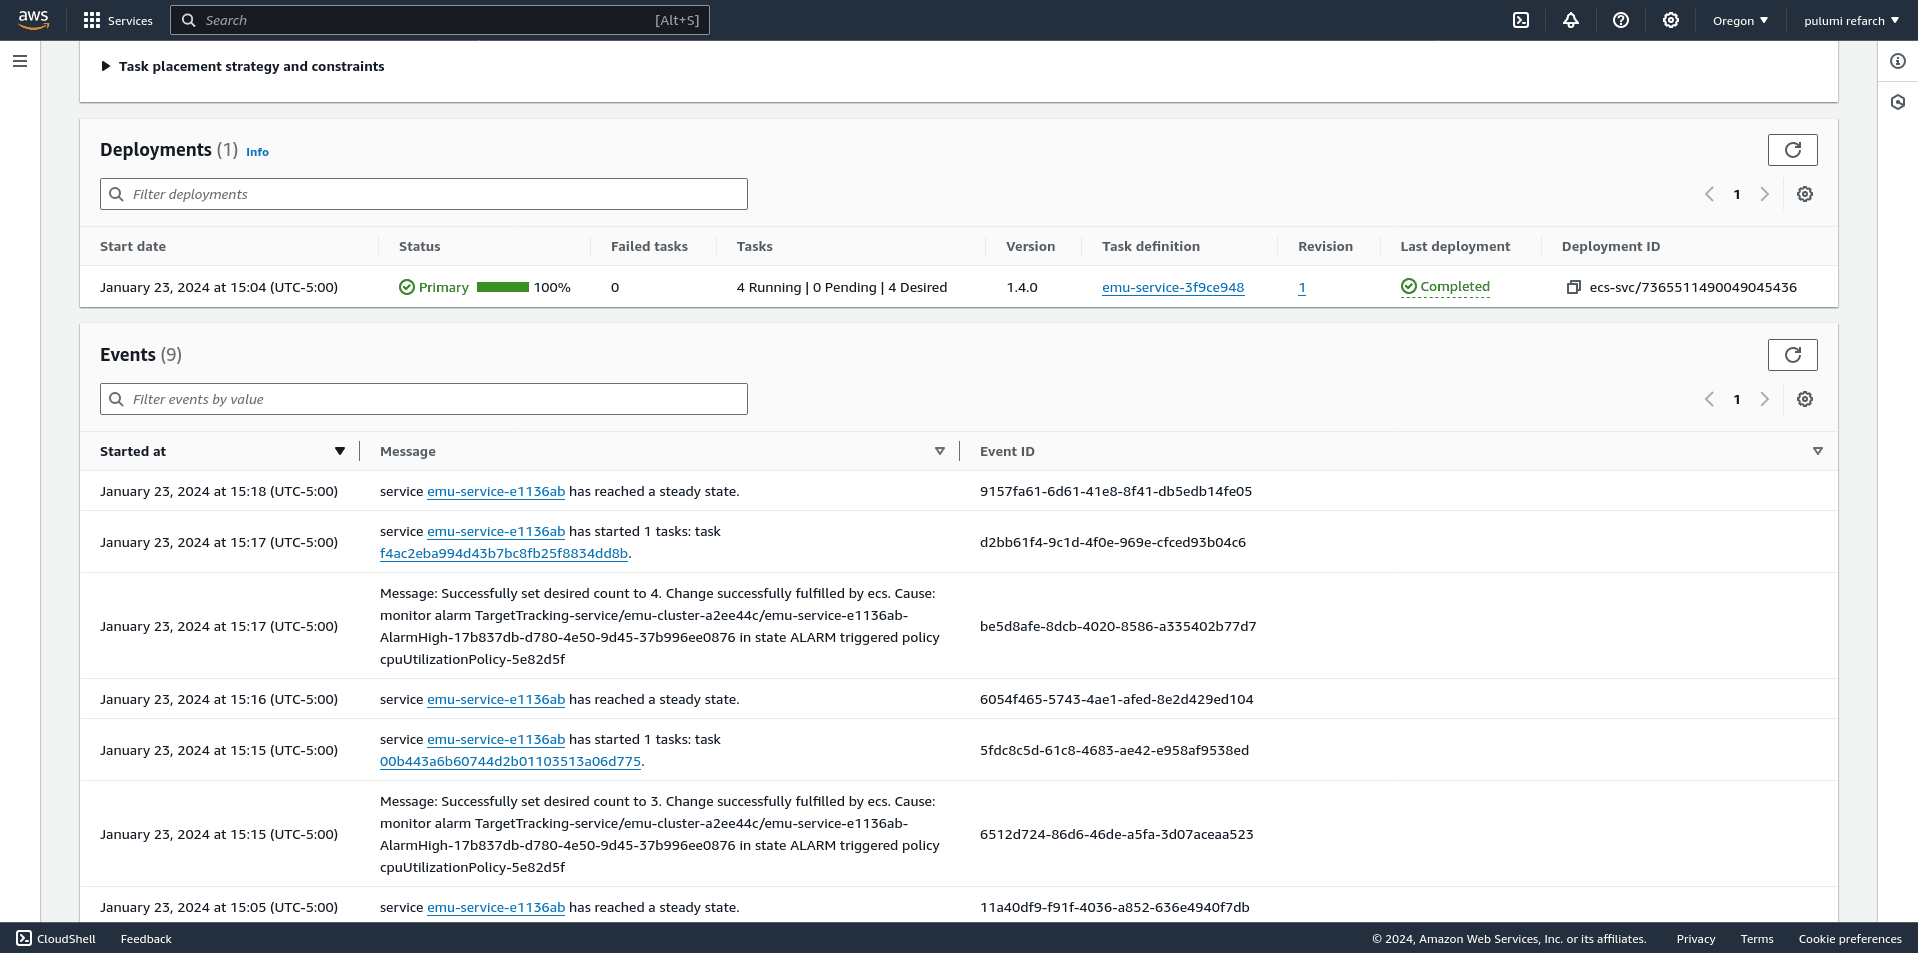
Within the AWS console, view the ECS service you’re interested in and scroll down to the Events panel. You will see entries such as:
| Timestamp | Event |
|---|---|
| @January 23, 2024 3:26 PM | service emu-service-e1136ab has reached a steady state. |
| @January 23, 2024 3:25 PM | service emu-service-e1136ab has started 4 tasks: task 53f713e6d1064a91a2963d4e071eefe4 task 9d10c30ba6fd47e3a2a72df607fd2e99 task 9ec953d161214a9ba2ec7ed0f1078dca task bbc83e2540d74479825234eb1921f265. |
| @January 23, 2024 3:25 PM | Message: Successfully set desired count to 14. Change successfully fulfilled by ecs. Cause: monitor alarm TargetTracking-service/emu-cluster-a2ee44c/emu-service-e1136ab-AlarmHigh-17b837db-d780-4e50-9d45-37b996ee0876 in state ALARM triggered policy cpuUtilizationPolicy-5e82d5f |
This is the human-legible history of our autoscaling policies and associated CloudWatch alarms.
We can see the autoscaling service increasing the number of running Emu workers in response to high system load.
Step 9. Monitor your Pinecone dashboard for metrics
The Pinecone dashboard exposes metrics, including your total vector count, requests and request errors, read units, and write units.
When load testing with the Pinecone AWS Reference Architecture in this way, it’s useful to keep your Pinecone dashboard open so you can easily monitor stats about your indexes.
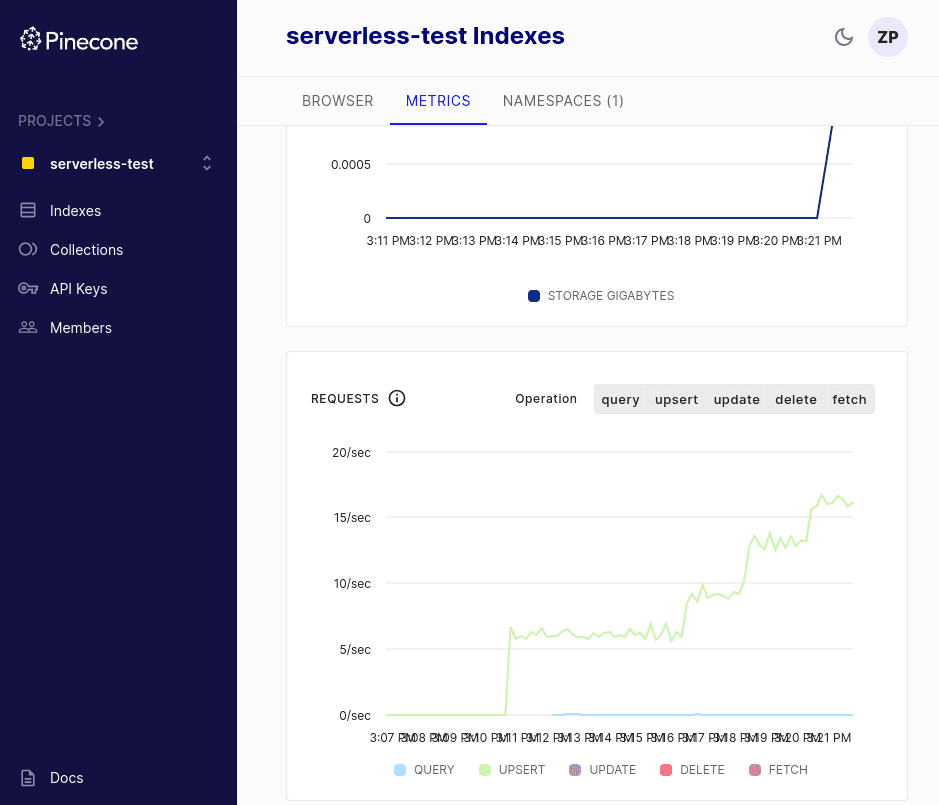
Log into your dashboard, select your index, and view metrics, including average upsert and query throughput. You can filter by time frame and even request type.
Thanks for reading!
This guide is a starting point for reaching your organization’s goals and scaling requirements. You can follow this pattern to insert an arbitrary number of messages and watch the autoscaling policies handle the load.
We also saw that by quickly tweaking values and deploying updates via pulumi up, you can use the Reference Architecture as a test bed for high-scale scenarios to help you more efficiently productionize your AI applications.
Was this article helpful?